A little over a year ago I started writing subunit2sql, which is a project to collect test results into a SQL DB. [1]The theory behind the project is that you can extract a great deal of information about what’s under test from the results of tests when you look at the trend data from it over a period of time. Over the past year the project has grown and matured quite a bit so I figured this was a good point to share what you can do with the project today and where I’d like to head with it over the next year.
I won’t go into the details too much about what subunit2sql is or some of the implementation details, I’ll save that for a follow-on post. In the meantime you can read the docs at: http://docs.openstack.org/developer/subunit2sql/ I also gave a talk earlier this year on subunit2sql for the Developer, Testing, Release and Continuous Integration Automation at LCA: https://www.youtube.com/watch?v=rGyDlExOs94 (although some of the details are a bit dated as things have evolved further since then)
At this point it’s mostly still just me contributing to the project, which is fine because I enjoy it and find it interesting. But, my time to experiment and work on this is limited and I know other people would likely be interested in contributing. I also think having diversity in contributors really helps a project come into it’s own, just by having different ideas coming to the table. I always get a little concerned whenever I’m basically the sole contributor to something. I figured I should share how the project is used today to try and drum up interest and fix this.
This is really a project I’m passionate about and if you have any interest in it or more questions, please feel free to reach out to me via email, the ML, or on irc.
[1] Note while the CLI tooling and the name imply the DB will only work with subunit v2 as a protocol for communicating test results, there actually isn’t anything inherent to subunit in the database schema or the library api provided by the package
subunit2sql in infra
Right now the subunit2sql is actively only doing 2 things, collecting test results from tempest in the gate queue and injecting results into testrepository for each tempest run.
Collecting results
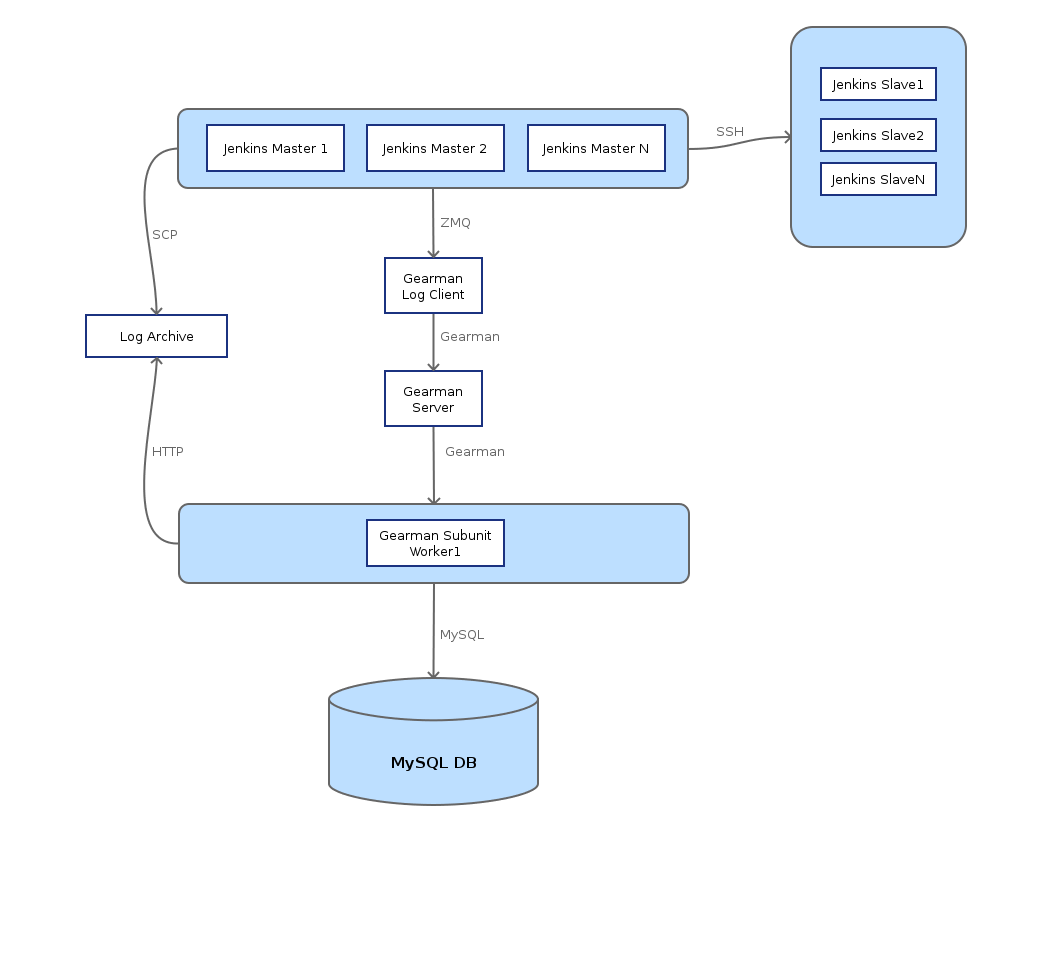
Since the final day of the Paris design summit we’ve been running a subunit2sql DB in openstack-infra that collects all the test results from tempest runs in the gate queue. The mechanism behind how for all this machinery is documented at: http://docs.openstack.org/infra/system-config/logstash.html it’s under the logstash page because the way subunit streams are collected from the test runs and eventually get stored in the database is the same mechanism and architecture that Clark Boylan created to store the logs from test runs into logstash. I just added a different worker which uses subunit2sql to handle subunit and store it in a mysql database. The basic overview diagram of how this works is:
One thing to note with the data collection is that it only collects data from tempest runs in the gate queue. We don’t collect results for check because it’s really too noisy to be useful and it would generate exponentially more data. I expect we’ll likely consider changing this at some point in the future as the UI around the data improves in the future. (and when we create a web interface for visualizing the data)
Injecting results into tempest runs
If you’ve looked at the console output of a tempest run in the gate at any point in the past 6-7 months you might have noticed something like:
|
1 2 3 4 5 6 7 8 9 10 11 12 13 14 15 16 17 18 19 20 21 22 23 24 25 26 27 28 29 30 31 32 33 34 35 36 37 38 39 |
<span class="NONE _2015-08-11_01_04_40_171"><a class="date" href="http://logs.openstack.org/29/211129/1/gate/gate-tempest-dsvm-full/2bbaacb/console.html#_2015-08-11_01_04_40_171" name="_2015-08-11_01_04_40_171">2015-08-11 01:04:40.171</a> | Loading previous tempest runs subunit streams into testr </span><span class="NONE _2015-08-11_01_04_40_171"><a class="date" href="http://logs.openstack.org/29/211129/1/gate/gate-tempest-dsvm-full/2bbaacb/console.html#_2015-08-11_01_04_40_171" name="_2015-08-11_01_04_40_171">2015-08-11 01:04:40.171</a> | /opt/stack/new/tempest /opt/stack/new/devstack </span><span class="NONE _2015-08-11_01_04_40_509"><a class="date" href="http://logs.openstack.org/29/211129/1/gate/gate-tempest-dsvm-full/2bbaacb/console.html#_2015-08-11_01_04_40_509" name="_2015-08-11_01_04_40_509">2015-08-11 01:04:40.509</a> | Ran 92 tests in 193.700s </span><span class="NONE _2015-08-11_01_04_40_509"><a class="date" href="http://logs.openstack.org/29/211129/1/gate/gate-tempest-dsvm-full/2bbaacb/console.html#_2015-08-11_01_04_40_509" name="_2015-08-11_01_04_40_509">2015-08-11 01:04:40.509</a> | PASSED (id=0, skips=37) </span><span class="NONE _2015-08-11_01_04_40_520"><a class="date" href="http://logs.openstack.org/29/211129/1/gate/gate-tempest-dsvm-full/2bbaacb/console.html#_2015-08-11_01_04_40_520" name="_2015-08-11_01_04_40_520">2015-08-11 01:04:40.520</a> | /opt/stack/new/devstack </span><span class="NONE _2015-08-11_01_04_40_520"><a class="date" href="http://logs.openstack.org/29/211129/1/gate/gate-tempest-dsvm-full/2bbaacb/console.html#_2015-08-11_01_04_40_520" name="_2015-08-11_01_04_40_520">2015-08-11 01:04:40.520</a> | /opt/stack/new/tempest /opt/stack/new/devstack </span><span class="NONE _2015-08-11_01_04_40_908"><a class="date" href="http://logs.openstack.org/29/211129/1/gate/gate-tempest-dsvm-full/2bbaacb/console.html#_2015-08-11_01_04_40_908" name="_2015-08-11_01_04_40_908">2015-08-11 01:04:40.908</a> | Ran 92 tests in 180.853s (-12.847s) </span><span class="NONE _2015-08-11_01_04_40_908"><a class="date" href="http://logs.openstack.org/29/211129/1/gate/gate-tempest-dsvm-full/2bbaacb/console.html#_2015-08-11_01_04_40_908" name="_2015-08-11_01_04_40_908">2015-08-11 01:04:40.908</a> | PASSED (id=1, skips=32) </span><span class="NONE _2015-08-11_01_04_40_922"><a class="date" href="http://logs.openstack.org/29/211129/1/gate/gate-tempest-dsvm-full/2bbaacb/console.html#_2015-08-11_01_04_40_922" name="_2015-08-11_01_04_40_922">2015-08-11 01:04:40.922</a> | /opt/stack/new/devstack </span><span class="NONE _2015-08-11_01_04_40_922"><a class="date" href="http://logs.openstack.org/29/211129/1/gate/gate-tempest-dsvm-full/2bbaacb/console.html#_2015-08-11_01_04_40_922" name="_2015-08-11_01_04_40_922">2015-08-11 01:04:40.922</a> | /opt/stack/new/tempest /opt/stack/new/devstack </span><span class="NONE _2015-08-11_01_04_41_502"><a class="date" href="http://logs.openstack.org/29/211129/1/gate/gate-tempest-dsvm-full/2bbaacb/console.html#_2015-08-11_01_04_41_502" name="_2015-08-11_01_04_41_502">2015-08-11 01:04:41.502</a> | Ran 388 (+296) tests in 1579.986s (+1399.133s) </span><span class="NONE _2015-08-11_01_04_41_502"><a class="date" href="http://logs.openstack.org/29/211129/1/gate/gate-tempest-dsvm-full/2bbaacb/console.html#_2015-08-11_01_04_41_502" name="_2015-08-11_01_04_41_502">2015-08-11 01:04:41.502</a> | PASSED (id=2, skips=32) </span><span class="NONE _2015-08-11_01_04_41_552"><a class="date" href="http://logs.openstack.org/29/211129/1/gate/gate-tempest-dsvm-full/2bbaacb/console.html#_2015-08-11_01_04_41_552" name="_2015-08-11_01_04_41_552">2015-08-11 01:04:41.552</a> | /opt/stack/new/devstack </span><span class="NONE _2015-08-11_01_04_41_552"><a class="date" href="http://logs.openstack.org/29/211129/1/gate/gate-tempest-dsvm-full/2bbaacb/console.html#_2015-08-11_01_04_41_552" name="_2015-08-11_01_04_41_552">2015-08-11 01:04:41.552</a> | /opt/stack/new/tempest /opt/stack/new/devstack </span><span class="NONE _2015-08-11_01_04_41_991"><a class="date" href="http://logs.openstack.org/29/211129/1/gate/gate-tempest-dsvm-full/2bbaacb/console.html#_2015-08-11_01_04_41_991" name="_2015-08-11_01_04_41_991">2015-08-11 01:04:41.991</a> | Ran 130 (-258) tests in 295.809s (-1284.176s) </span><span class="NONE _2015-08-11_01_04_41_991"><a class="date" href="http://logs.openstack.org/29/211129/1/gate/gate-tempest-dsvm-full/2bbaacb/console.html#_2015-08-11_01_04_41_991" name="_2015-08-11_01_04_41_991">2015-08-11 01:04:41.991</a> | PASSED (id=3, skips=17) </span><span class="NONE _2015-08-11_01_04_42_005"><a class="date" href="http://logs.openstack.org/29/211129/1/gate/gate-tempest-dsvm-full/2bbaacb/console.html#_2015-08-11_01_04_42_005" name="_2015-08-11_01_04_42_005">2015-08-11 01:04:42.005</a> | /opt/stack/new/devstack </span><span class="NONE _2015-08-11_01_04_42_005"><a class="date" href="http://logs.openstack.org/29/211129/1/gate/gate-tempest-dsvm-full/2bbaacb/console.html#_2015-08-11_01_04_42_005" name="_2015-08-11_01_04_42_005">2015-08-11 01:04:42.005</a> | /opt/stack/new/tempest /opt/stack/new/devstack </span><span class="NONE _2015-08-11_01_04_42_491"><a class="date" href="http://logs.openstack.org/29/211129/1/gate/gate-tempest-dsvm-full/2bbaacb/console.html#_2015-08-11_01_04_42_491" name="_2015-08-11_01_04_42_491">2015-08-11 01:04:42.491</a> | Ran 130 tests in 304.811s (+9.002s) </span><span class="NONE _2015-08-11_01_04_42_491"><a class="date" href="http://logs.openstack.org/29/211129/1/gate/gate-tempest-dsvm-full/2bbaacb/console.html#_2015-08-11_01_04_42_491" name="_2015-08-11_01_04_42_491">2015-08-11 01:04:42.491</a> | PASSED (id=4, skips=17) </span><span class="NONE _2015-08-11_01_04_42_505"><a class="date" href="http://logs.openstack.org/29/211129/1/gate/gate-tempest-dsvm-full/2bbaacb/console.html#_2015-08-11_01_04_42_505" name="_2015-08-11_01_04_42_505">2015-08-11 01:04:42.505</a> | /opt/stack/new/devstack </span><span class="NONE _2015-08-11_01_04_42_506"><a class="date" href="http://logs.openstack.org/29/211129/1/gate/gate-tempest-dsvm-full/2bbaacb/console.html#_2015-08-11_01_04_42_506" name="_2015-08-11_01_04_42_506">2015-08-11 01:04:42.506</a> | /opt/stack/new/tempest /opt/stack/new/devstack </span><span class="NONE _2015-08-11_01_04_42_792"><a class="date" href="http://logs.openstack.org/29/211129/1/gate/gate-tempest-dsvm-full/2bbaacb/console.html#_2015-08-11_01_04_42_792" name="_2015-08-11_01_04_42_792">2015-08-11 01:04:42.792</a> | PASSED (id=5) </span><span class="NONE _2015-08-11_01_04_42_801"><a class="date" href="http://logs.openstack.org/29/211129/1/gate/gate-tempest-dsvm-full/2bbaacb/console.html#_2015-08-11_01_04_42_801" name="_2015-08-11_01_04_42_801">2015-08-11 01:04:42.801</a> | /opt/stack/new/devstack </span><span class="NONE _2015-08-11_01_04_42_801"><a class="date" href="http://logs.openstack.org/29/211129/1/gate/gate-tempest-dsvm-full/2bbaacb/console.html#_2015-08-11_01_04_42_801" name="_2015-08-11_01_04_42_801">2015-08-11 01:04:42.801</a> | /opt/stack/new/tempest /opt/stack/new/devstack </span><span class="NONE _2015-08-11_01_04_43_193"><a class="date" href="http://logs.openstack.org/29/211129/1/gate/gate-tempest-dsvm-full/2bbaacb/console.html#_2015-08-11_01_04_43_193" name="_2015-08-11_01_04_43_193">2015-08-11 01:04:43.193</a> | Ran 130 (+130) tests in 346.516s </span><span class="NONE _2015-08-11_01_04_43_193"><a class="date" href="http://logs.openstack.org/29/211129/1/gate/gate-tempest-dsvm-full/2bbaacb/console.html#_2015-08-11_01_04_43_193" name="_2015-08-11_01_04_43_193">2015-08-11 01:04:43.193</a> | PASSED (id=6, skips=22) </span><span class="NONE _2015-08-11_01_04_43_204"><a class="date" href="http://logs.openstack.org/29/211129/1/gate/gate-tempest-dsvm-full/2bbaacb/console.html#_2015-08-11_01_04_43_204" name="_2015-08-11_01_04_43_204">2015-08-11 01:04:43.204</a> | /opt/stack/new/devstack </span><span class="NONE _2015-08-11_01_04_43_204"><a class="date" href="http://logs.openstack.org/29/211129/1/gate/gate-tempest-dsvm-full/2bbaacb/console.html#_2015-08-11_01_04_43_204" name="_2015-08-11_01_04_43_204">2015-08-11 01:04:43.204</a> | /opt/stack/new/tempest /opt/stack/new/devstack </span><span class="NONE _2015-08-11_01_04_43_695"><a class="date" href="http://logs.openstack.org/29/211129/1/gate/gate-tempest-dsvm-full/2bbaacb/console.html#_2015-08-11_01_04_43_695" name="_2015-08-11_01_04_43_695">2015-08-11 01:04:43.695</a> | Ran 130 tests in 299.969s (-46.548s) </span><span class="NONE _2015-08-11_01_04_43_695"><a class="date" href="http://logs.openstack.org/29/211129/1/gate/gate-tempest-dsvm-full/2bbaacb/console.html#_2015-08-11_01_04_43_695" name="_2015-08-11_01_04_43_695">2015-08-11 01:04:43.695</a> | PASSED (id=7, skips=17) </span><span class="NONE _2015-08-11_01_04_43_705"><a class="date" href="http://logs.openstack.org/29/211129/1/gate/gate-tempest-dsvm-full/2bbaacb/console.html#_2015-08-11_01_04_43_705" name="_2015-08-11_01_04_43_705">2015-08-11 01:04:43.705</a> | /opt/stack/new/devstack </span><span class="NONE _2015-08-11_01_04_43_705"><a class="date" href="http://logs.openstack.org/29/211129/1/gate/gate-tempest-dsvm-full/2bbaacb/console.html#_2015-08-11_01_04_43_705" name="_2015-08-11_01_04_43_705">2015-08-11 01:04:43.705</a> | /opt/stack/new/tempest /opt/stack/new/devstack </span><span class="NONE _2015-08-11_01_04_44_119"><a class="date" href="http://logs.openstack.org/29/211129/1/gate/gate-tempest-dsvm-full/2bbaacb/console.html#_2015-08-11_01_04_44_119" name="_2015-08-11_01_04_44_119">2015-08-11 01:04:44.119</a> | Ran 130 tests in 337.152s (+37.183s) </span><span class="NONE _2015-08-11_01_04_44_119"><a class="date" href="http://logs.openstack.org/29/211129/1/gate/gate-tempest-dsvm-full/2bbaacb/console.html#_2015-08-11_01_04_44_119" name="_2015-08-11_01_04_44_119">2015-08-11 01:04:44.119</a> | PASSED (id=8, skips=22) </span><span class="NONE _2015-08-11_01_04_44_129"><a class="date" href="http://logs.openstack.org/29/211129/1/gate/gate-tempest-dsvm-full/2bbaacb/console.html#_2015-08-11_01_04_44_129" name="_2015-08-11_01_04_44_129">2015-08-11 01:04:44.129</a> | /opt/stack/new/devstack </span><span class="NONE _2015-08-11_01_04_44_129"><a class="date" href="http://logs.openstack.org/29/211129/1/gate/gate-tempest-dsvm-full/2bbaacb/console.html#_2015-08-11_01_04_44_129" name="_2015-08-11_01_04_44_129">2015-08-11 01:04:44.129</a> | /opt/stack/new/tempest /opt/stack/new/devstack </span><span class="NONE _2015-08-11_01_04_44_509"><a class="date" href="http://logs.openstack.org/29/211129/1/gate/gate-tempest-dsvm-full/2bbaacb/console.html#_2015-08-11_01_04_44_509" name="_2015-08-11_01_04_44_509">2015-08-11 01:04:44.509</a> | Ran 130 tests in 348.047s (+10.895s) </span><span class="NONE _2015-08-11_01_04_44_509"><a class="date" href="http://logs.openstack.org/29/211129/1/gate/gate-tempest-dsvm-full/2bbaacb/console.html#_2015-08-11_01_04_44_509" name="_2015-08-11_01_04_44_509">2015-08-11 01:04:44.509</a> | PASSED (id=9, skips=22)</span> |
in the console output from the run. This is devstack-gate loading the results from 10 previous results into testrepository before we start executing tempest. This is done to give testr a chance to optimize the test grouping to make the tests run on each worker a bit more balanced. It’s honestly a half feature, because testr’s scheduler is limited and only stores the most recent execution of a test in it’s local timing dbm file and we’re unable to use the avg. execution times from the DB because of: https://bugs.launchpad.net/testrepository/+bug/1416512 To get around that bug in the meantime we just preload the nodepool images with the subunit streams of the 10 most recent runs in the database. (using sql2subunit) This actually doesn’t really affect the performance of test runs at all or really have any noticeable effect. Long term we’ll hopefully improve this a bit and make it more useful.
Elastic-recheck
A future use case in openstack-infra for subunit2sql is also to use the subunit2sql DB as a secondary data source for elastic recheck. This would enable some additional filtering or checking in e-r queries based on test results, which might be useful in certain circumstances. I have a patch up that is starting work on this here: https://review.openstack.org/209712
Playing with things on your own
Talking to the gate’s DB
This is probably a terrible idea because it’s just asking for a DOS attack on the “production” DB which runs on a tiny trove node on RAX’s public cloud, but to connect to the mysql server you can use the following public read only credentials:
- hostname: logstash.openstack.org
- username: query
- password: query
- database: subunit2sql
All of the data we’ve collected about tests since Nov. of last year is stored there. As I said before the only test data in the database is from tempest runs in the gate. (there was a brief period in where the filtering wasn’t perfect and there are some check queue jobs that got into the DB)
subunit2sql-graph
This is where we start to get into the fun part and generate some pretty pictures. subunit2sql-graph is a CLI tool for generating visualizations from the data in the DB. It’s got a few different graph types right now that mainly use pandas and matplotlib to generate a image file of a graph using data in the database. More details on the graph command can be found at the command’s doc page: http://docs.openstack.org/developer/subunit2sql/graph.html#subunit2sql-graph I’ll only cover a couple of different graphs right now but you can play around with them all using the public DB credentials.
Test Run Time
This is the first graphing I really added to subunit2sql. It lets you graph the run time of an individual test as a time series. Like:
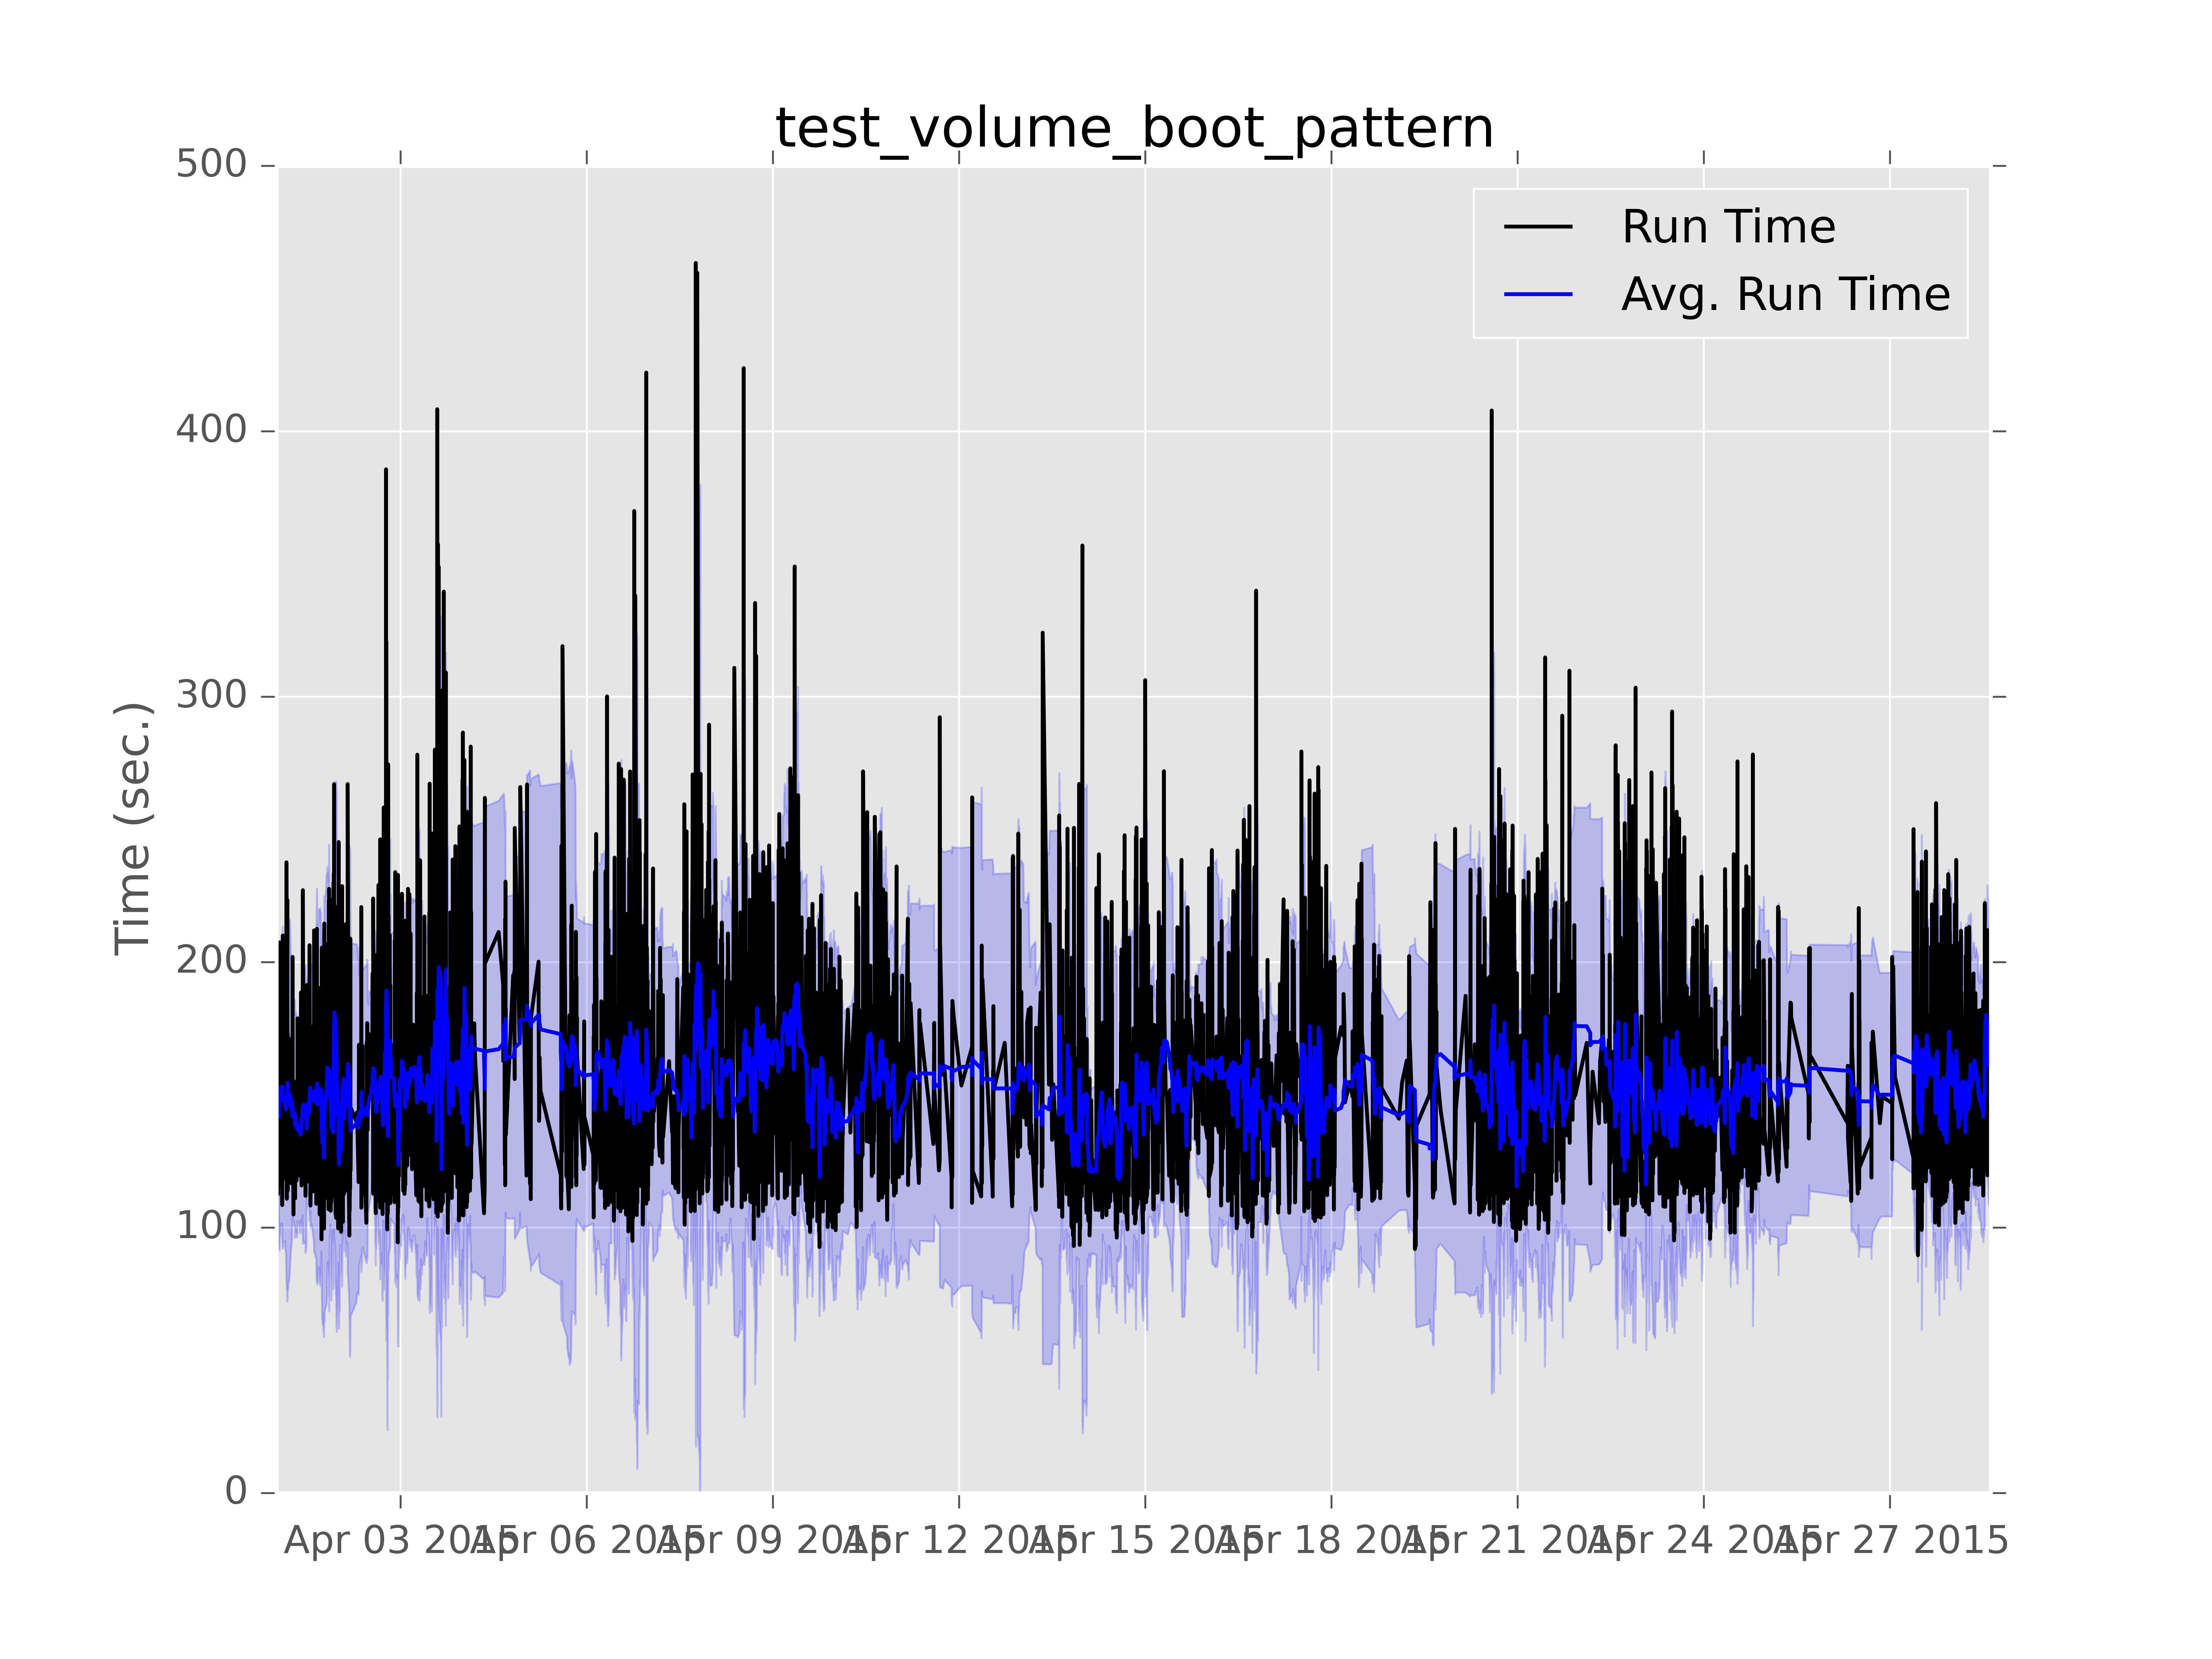
Which is a graph I generated some time ago to test what is now the current output formatting. (although the x axis labels were still wrong back then) The light blue shading is standard deviation of the test run time. I used this as an example because it’s a good example to show off how variable the performance is for things running in the gate.
Performance analysis
However, the real advantage of generating these graphs is it lets you identify performance regressions and also verify that they were fixed. Here is a real world example,
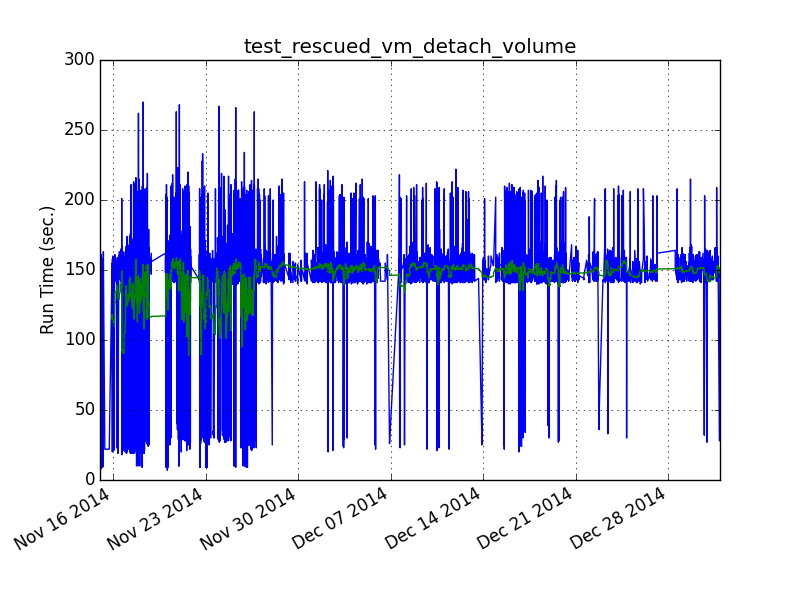
the first line graph of run time I ever generated using subunit2sql was (which is why the format is different):
Looking at this graph there is a clear bifurcation in the data. We can see that most of the time the test takes about 150 secs. (with the normal gate variance) but a noticeable amount of times it was running considerably faster, taking < 50 sec.
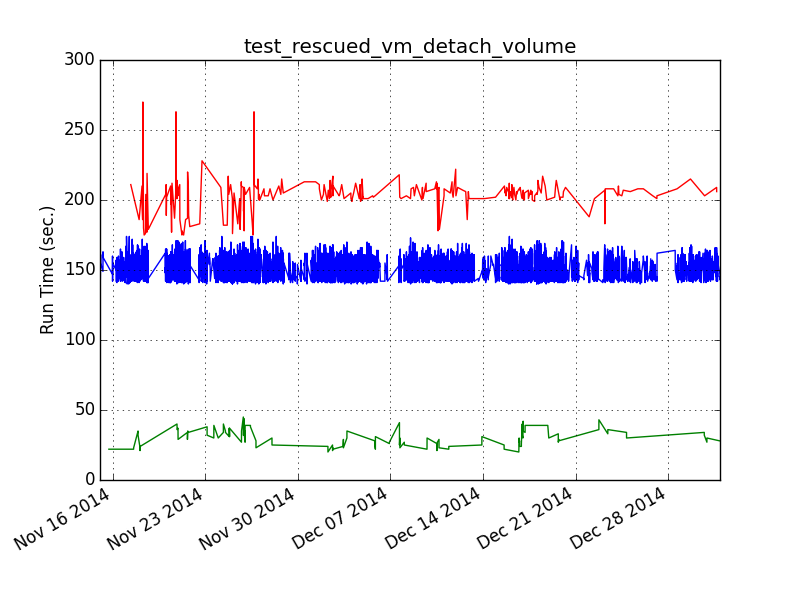
So I wrote a separate tool (although this predates the plugin interface so it was just a script) that grouped the tests on arbitrary boundaries graphed them separately and then printed the metadata from the runs that made up each group:
The resulting graph shows a clear split between the bottom group and the top groups. What’s more important is the metadata showed that the bottom group, which ran considerably faster, was completely comprised of jobs running on the stable/icehouse branch (which also ran on an older ubuntu) This means that at some point during juno we introduced a change somewhere that made this test perform quite a bit slower. (or less likely there was a regression in ubuntu between precise and trusty)
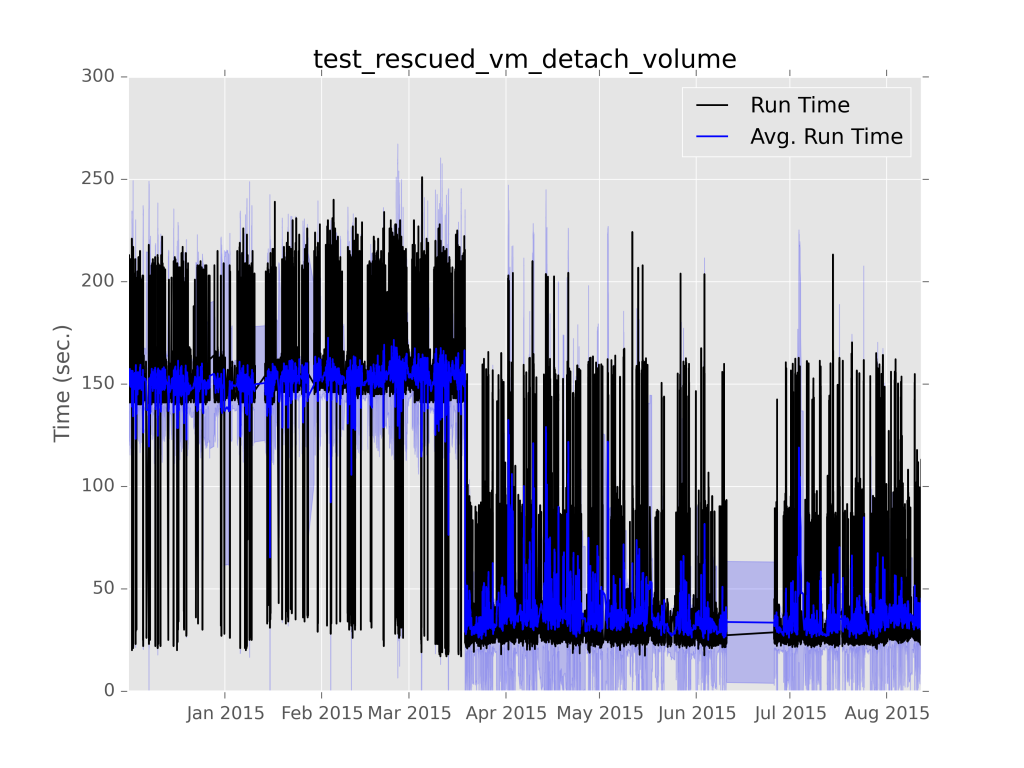
It turns out we were already tracking this issue in this bug, because we’d see test failures in certain cases because volume deletes were too slow. It was eventually fixed which is actually where this gets really cool. If you run the graph command today on this test with:
$ subunit2sql-graph –start-date 2014-12-01 –database-connection=”mysql://query:query@logstash.openstack.org/subunit2sql” –title “test_rescued_vm_detach_volume” –output perf-regression.png run_time 0291fc87-1a6d-4c6b-91d2-00a7bb5c63e6
You get:
The first part of shows what the graphs above were showing, the run times clearly divided between two groups, but averaging much slower. However, in March you can clearly see where that trend flipped on it’s head and the average runtime became much faster with consistent outliers being slower. That turning point happens to match up perfectly with: http://git.openstack.org/cgit/openstack-dev/devstack/commit/?id=4bf861c76c220a98a3b3165eea5448411d000f3a which was the fix for this particular performance regression. The slow outliers after that commit are actually stable/juno runs because that’s never been backported from kilo to juno.
Run Metadata Variance Graphing:
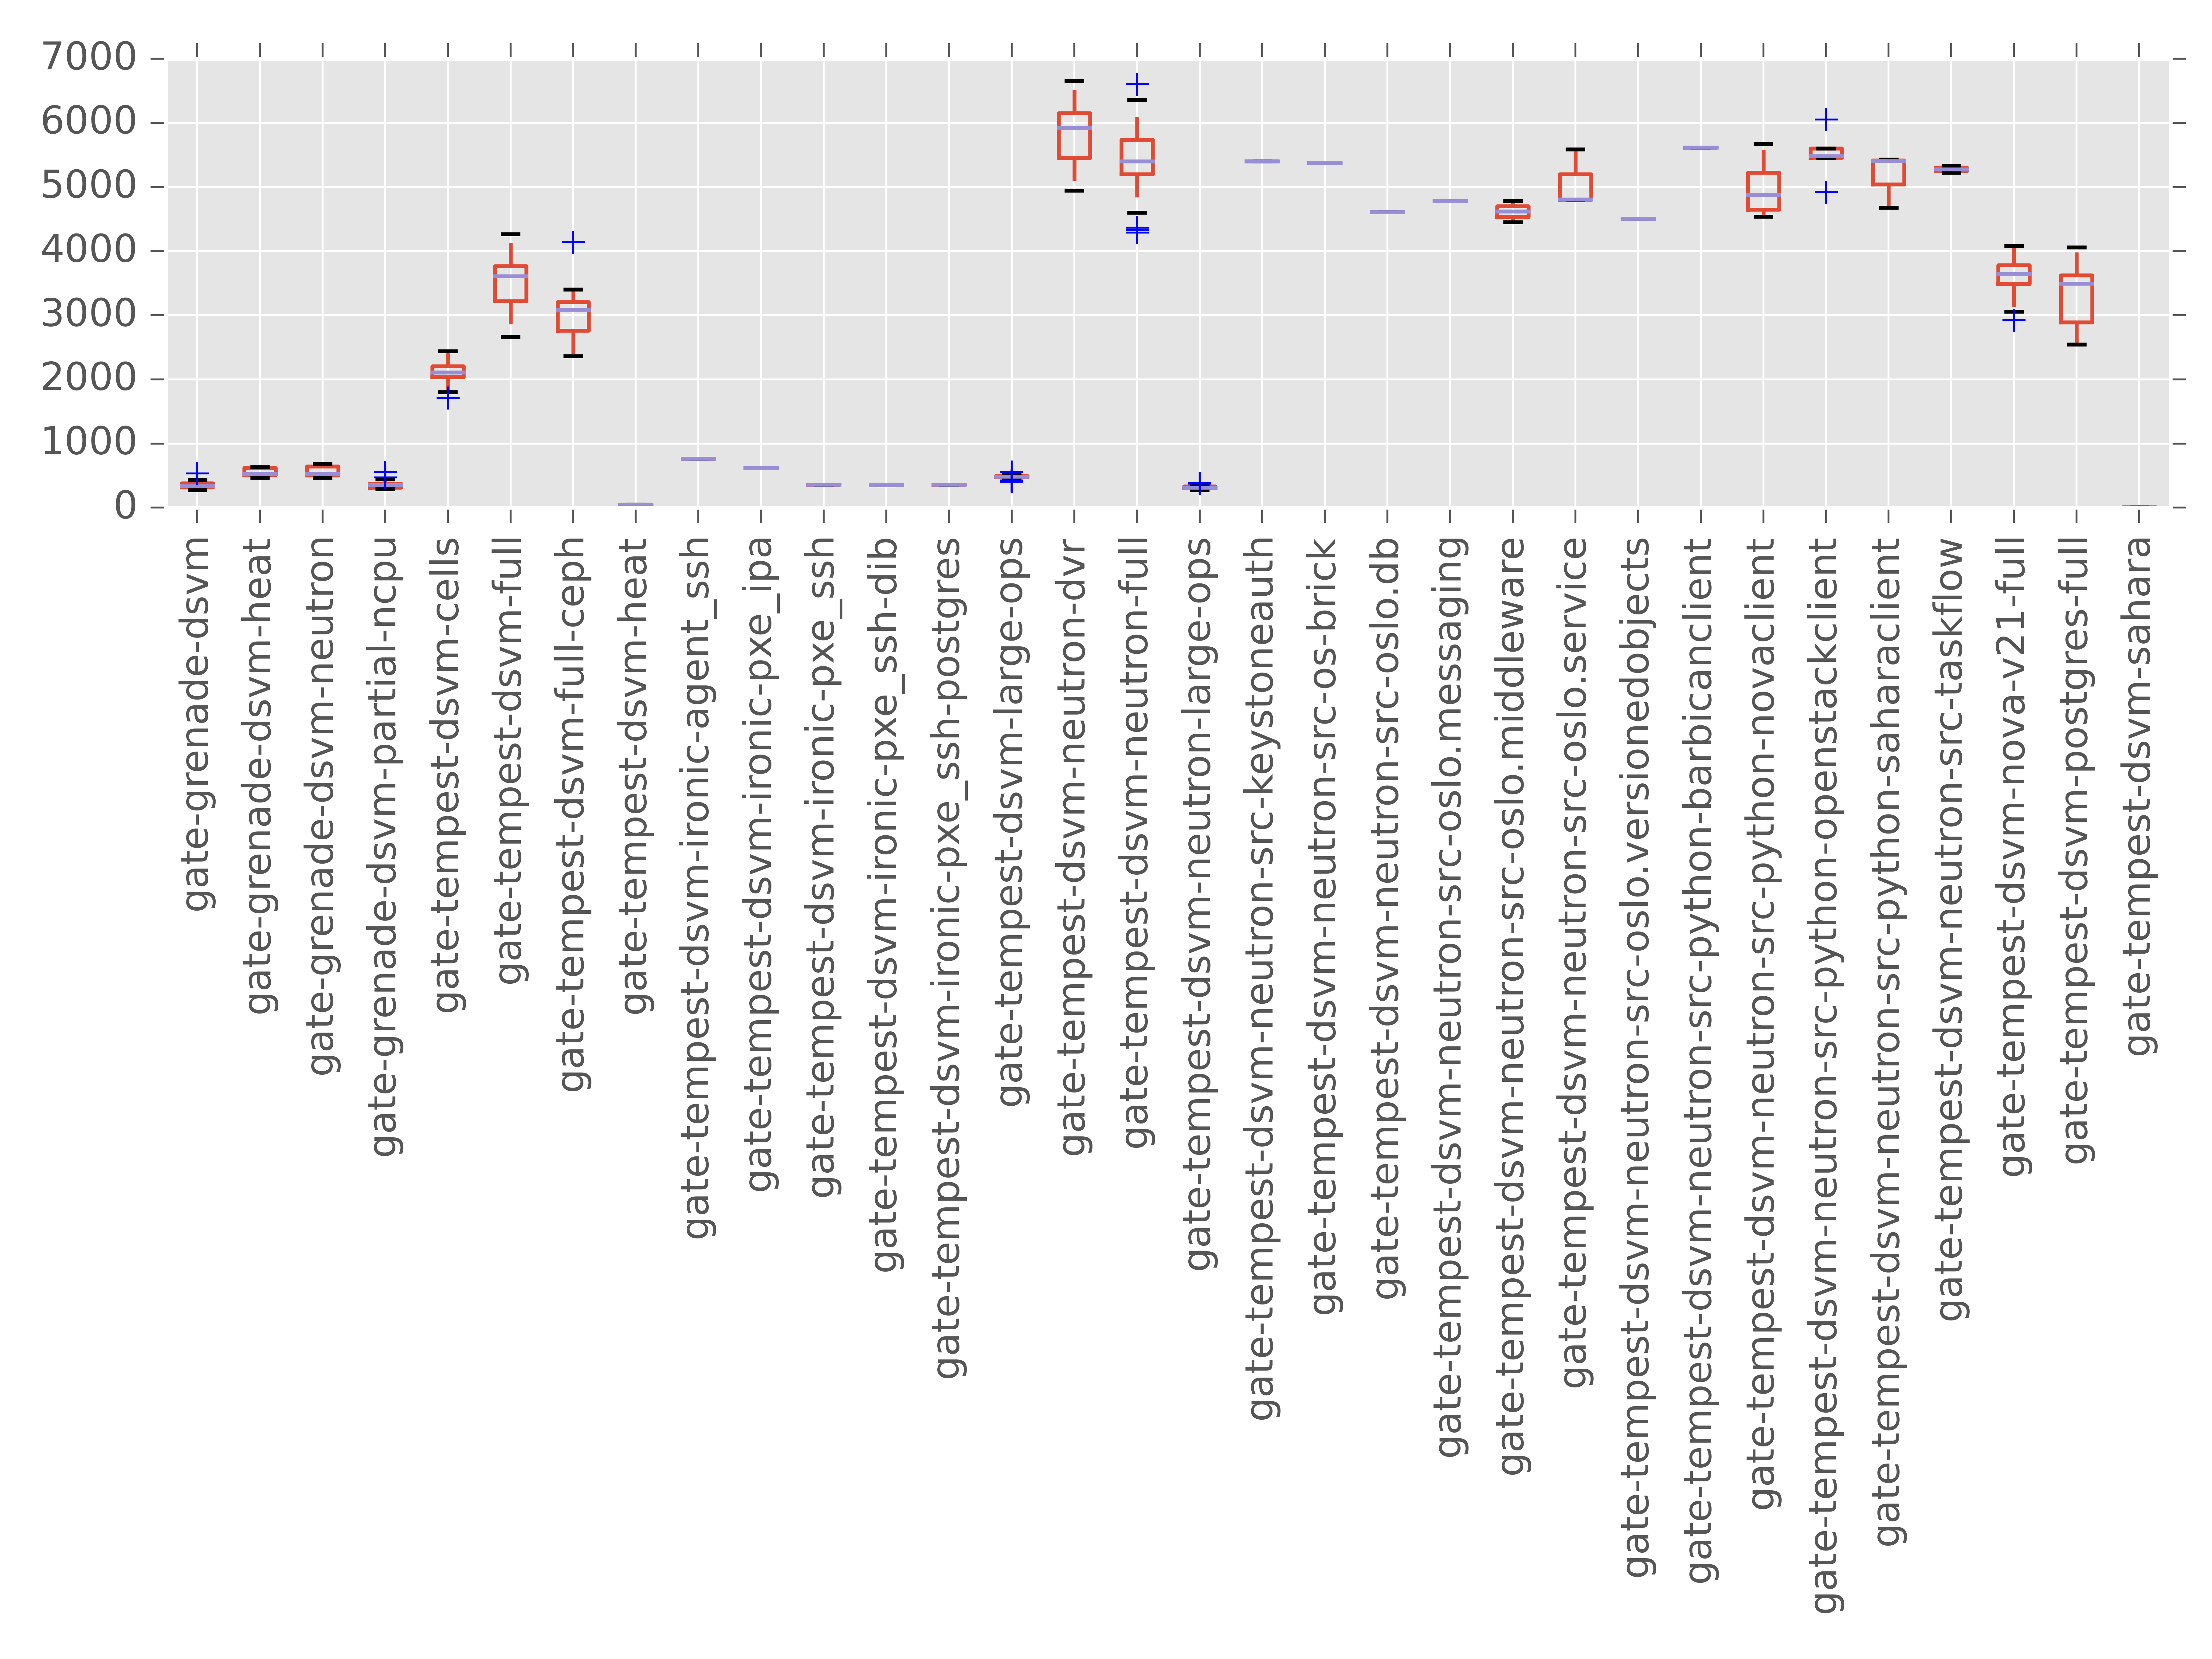
This is a feature still in progress here: https://review.openstack.org/#/c/210569/ but I figured I share it because it helps explore one of the themes from the previous section. Mainly that one thing that subunit2sql enables you to show quantitatively is how variable performance can actually be, especially in the gate. This is honestly completely expected when you consider both OpenStack’s architecture of being a distributed asynchronous message passing system and the gate jobs are deploying and running clouds inside VMs in public clouds of various flavors. Looking at a single run (or even a small set of runs) in isolation won’t be able to ever give you real information about how things actually perform. I’m adding this graph to try and visualize how different the variability is in total run time depending on the run metadata. For example:
This was the result result of running the graph command on about a full day’s worth of runs. The missing y axis label is time in sec., although the actual number is a bit misleading, since it’s the sum of the individual test run times for the run. Which by itself has 2 issues, that it doesn’t account for setUp or tearDown, which can be quite expensive in tempest, and that it doesn’t take into account things are executed in parallel it’s basically cpu time. But for showing the variance of runs these issues should not change the effectiveness of the graph. Also, I’m biased against box and whiskers so I might try some other type of visualization before this merges. But, at the very least this enables you to see how variable performance can be based on job type at a high level.
Make your own graphs
The other aspect of subunit2sql-graph is that it has a plugin interface. This lets you write your own plugins for subunit2sql-graph to generate whatever graphs you want. There are likely cases where it’s not really possible to make a graph generic enough to be considered for upstream inclusion. (like if it depends on specific contents of metadata) So having a plugin interface makes it easy to bake it into the same tooling as the other graphs being generated and share common configuration between them.
Manually querying data
Unfortunately, the CLI tooling around interacting with a subunit2sql DB isn’t as mature I’d really like. I also think having a web interface to the data will help a lot here too. But, unfortunately this is all still pretty much nonexistent at this point. So you might have to end up manually querying the DB to get the information you’re looking for. For example one of the things missing is average run failure rates from the CLI. (you can get per test failure rates from subunit2sql-graph) You will have to query that information manually with:
$ mysql -u query --password=query --hostname logstash.openstack.org subunit2sql

MySQL [subunit2sql]> select count(id) from runs where fails>0;

+-----------+

| count(id) |

+-----------+

| 2482 |

+-----------+

1 row in set (0.09 sec)
MySQL [subunit2sql]> select count(id) from runs where passes>0 or fails>0;
+———–+
| count(id) |
+———–+
| 143127 |
+———–+
1 row in set (0.21 sec)
so in the gate queue we’ve had a average tempest run failure rate of ~1.73% which is actually higher than I thought it was. (also realize this only counts runs that failed tempest. Devstack failures, other setup and infra failures, or any other test job failures do not factor into this number) It’s also not really a fair measurement because some tempest jobs fail much more frequently than others. But it’s a simple example of what to you can do with manually querying.
Next steps for subunit2sql
There are a couple of things that I’d really like to finish over the next year with subunit2sql some are code cleanup and others are use case and feature expansion.
UI/UX
So this is honestly what I think has been the biggest barrier for getting people excited about all of this. I freely admit that this is an area I lack expertise in, a good interface for me is ncurses application with vim key bindings. (which is probably not the best way to do data visualization) This is really why most of the interfaces to subunit2sql and the data are very raw. What we really need here is a web interface which shows all the things I’ve been doing manually in a dynamic way to enable people to just look at things and not have to think too much about the underlying data model.
We’re running a gazillion of tests all the time, and we’re aren’t getting the full value from these test runs by just looking at them in a strictly binary pass fail manner. We are definitely able to extract a lot more information about OpenStack as we’re developing it. We’ve already got a very large amount of data already collected in the database (107108401 individual test executions at one point while I was writing this post) and it could really provide a great deal of value to the development community. The perfect example is the run time graphs I showed above. But, this is really one aspect that I need the most help on before I think the larger community would see any advantage to having this resource available.
testrepository integration
This has been a big priority ever since I started working on the project. Using subunit2sql as a repository type in testrepository makes a ton of sense. Once this is implemented I’m planning to work with Robert Collins to eventually make this the default repository type in testrepository. It’ll enable leveraging all of the work being done here for anyone running tests with testr, but at a minimum it’ll expose a much more rich data store for testrepository to use for it’s own operations. I actually stared hacking on an implementation for this a long time ago but things in subunit2sql weren’t really ready back then so I abandoned it before I got to far. (FWIW, it doesn’t look too difficult to do)
There are a couple of things still to accomplish before we can do this. The first, which should be fairly trivial is add support to sql2subunit (and the associated python APIs it exposes and consumes) to handle attachments in the output subunit stream. The other thing which isn’t technically a blocker to implement this, but would be a huge blocker to adoption is support for sqlite in the migrations. Dropping sqlite was one of my early mistakes in the project because at the time supporting it seemed like a burden and I didn’t really think about the implications. My plan for this is basically branch the DB migrations and compact them into a single migration which works with sqlite, this will enable to new users to setup a database with sqlite . This will be the first step of the 1.x.x release series. (I have a WIP patch up for this here: https://review.openstack.org/203252)
Testing
So the irony isn’t lost on me of being OpenStack’s QA PTL and writing a project that has basically non-existent test coverage. But, honestly it’s something I hadn’t put too much thought into for a long time, since I was more interested in getting something together and using it. But, this has definitely hurt the project in the long run because it just makes verifying new changes much more difficult. To really help the project grow we need to improve this so that we can verify changes without having to pull them locally and run them. There is a TODO file in tree which I try to keep up to date with work items that need doing. A good portion of them are testing related: https://github.com/openstack-infra/subunit2sql/blob/master/TODO.rst
2 thoughts on “Using subunit2sql with the gate”