A few months ago at the Liberty QA code sprint in Ft. Collins, CO we started work on the OpenStack-Health dashboard. I also recently announced the dashboard to the openstack-dev ML to try and raise it to the attention of the broader community and to try and get more users and feedback on how to improve things. I figured it’d be good to write up a more detailed post on the basics of how the dashboard is constructed, it’s current capabilities and limitations, and where we’d like to see it move in the future. Especially given that the number of contributors to the project is still quite small. For the project to really grow and be useful for everyone in the community we need more people helping out on it.
This is sort of building off my earlier post on using subunit2sql in the gate. A lot of what’s described in that post has been used to build the current dashboard. Also, in that post I referenced having a web ui in the future which is exactly what openstack-health is.
Architecture
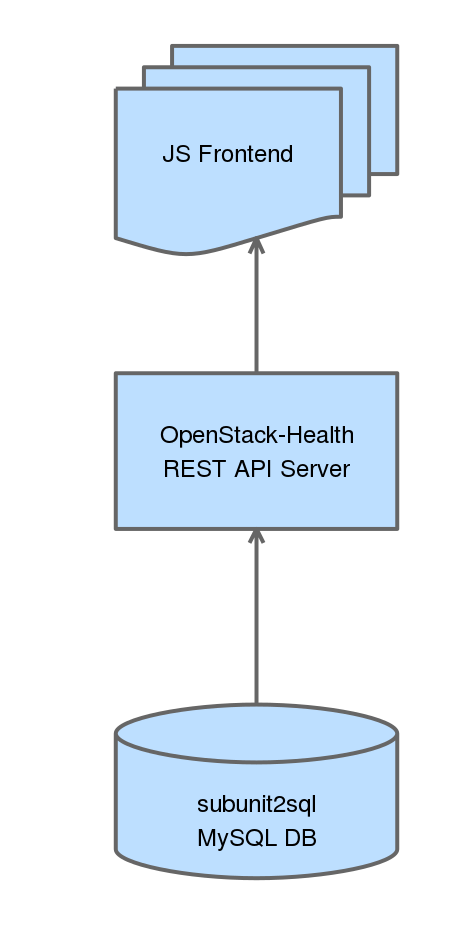
OpenStack-Health has 2 basic components a REST API server which we have deployed at http://health.openstack.org and the JS frontend which we host at http://status.openstack.org/openstack-health. Both of these components are deployed in openstack-infra using the puppet-openstack_health module. Everything is continuously deployed meaning that when a change lands in the openstack-health repository it’ll be applied in production on the next periodic puppet run.
REST API Server
The REST API server is actually very simple. It is basically a flask wrapper around the subunit2sql DB API that will perform DB queries and then perform any additional operations on the data, reformatting, and serializes it as JSON. So when a request comes in the API will dynamically query a subunit2sql db to generate it’s response. It’s also worth pointing out that there are no stability guarantees on this rest api. It’s not really intended to provide a stable interface for external consumption. So if you decide to write your own tooling using it you might end up being broken without any warning.
The API service is decoupled from subunit2sql for a couple of reasons, the biggest being that we wanted to hard encode this for OpenStack’s CI use case to a certain degree. (ie it’s not a generic subunit2sql REST API) The other reason for this to not be part of subunit2sql is that long term it’s probable that we’ll end up querying more than just a subunit2sql DB. In this case keeping the REST API in subunit2sql wouldn’t make much sense.
JS frontend
This is where the pretty stuff happens. The JS frontend is written in AngularJS (originally based on the basic setup Tim Buckley and Austin Clark used in the stackviz project) and currently uses nvd3 to do the graphing. (this will likely change to use a combination of both nvd3 and straight d3 in the future) The JS frontend is entirely client side and is just statically hosted. Everything is done in your local browser. It will send requests to the REST API server to get the data, do some local processing, which mostly consists of splitting data into different pieces for the different graphs and tables, and then renders everything.
Current capabilities
I figured it would be good to give a quick overview of the current capabilities for the dashboard. This will likely go stale very quickly because the project is continuously deployed and under active development.
The default page on the dashboard will let you look at all runs at a high level and then show grouped fail and pass rates:
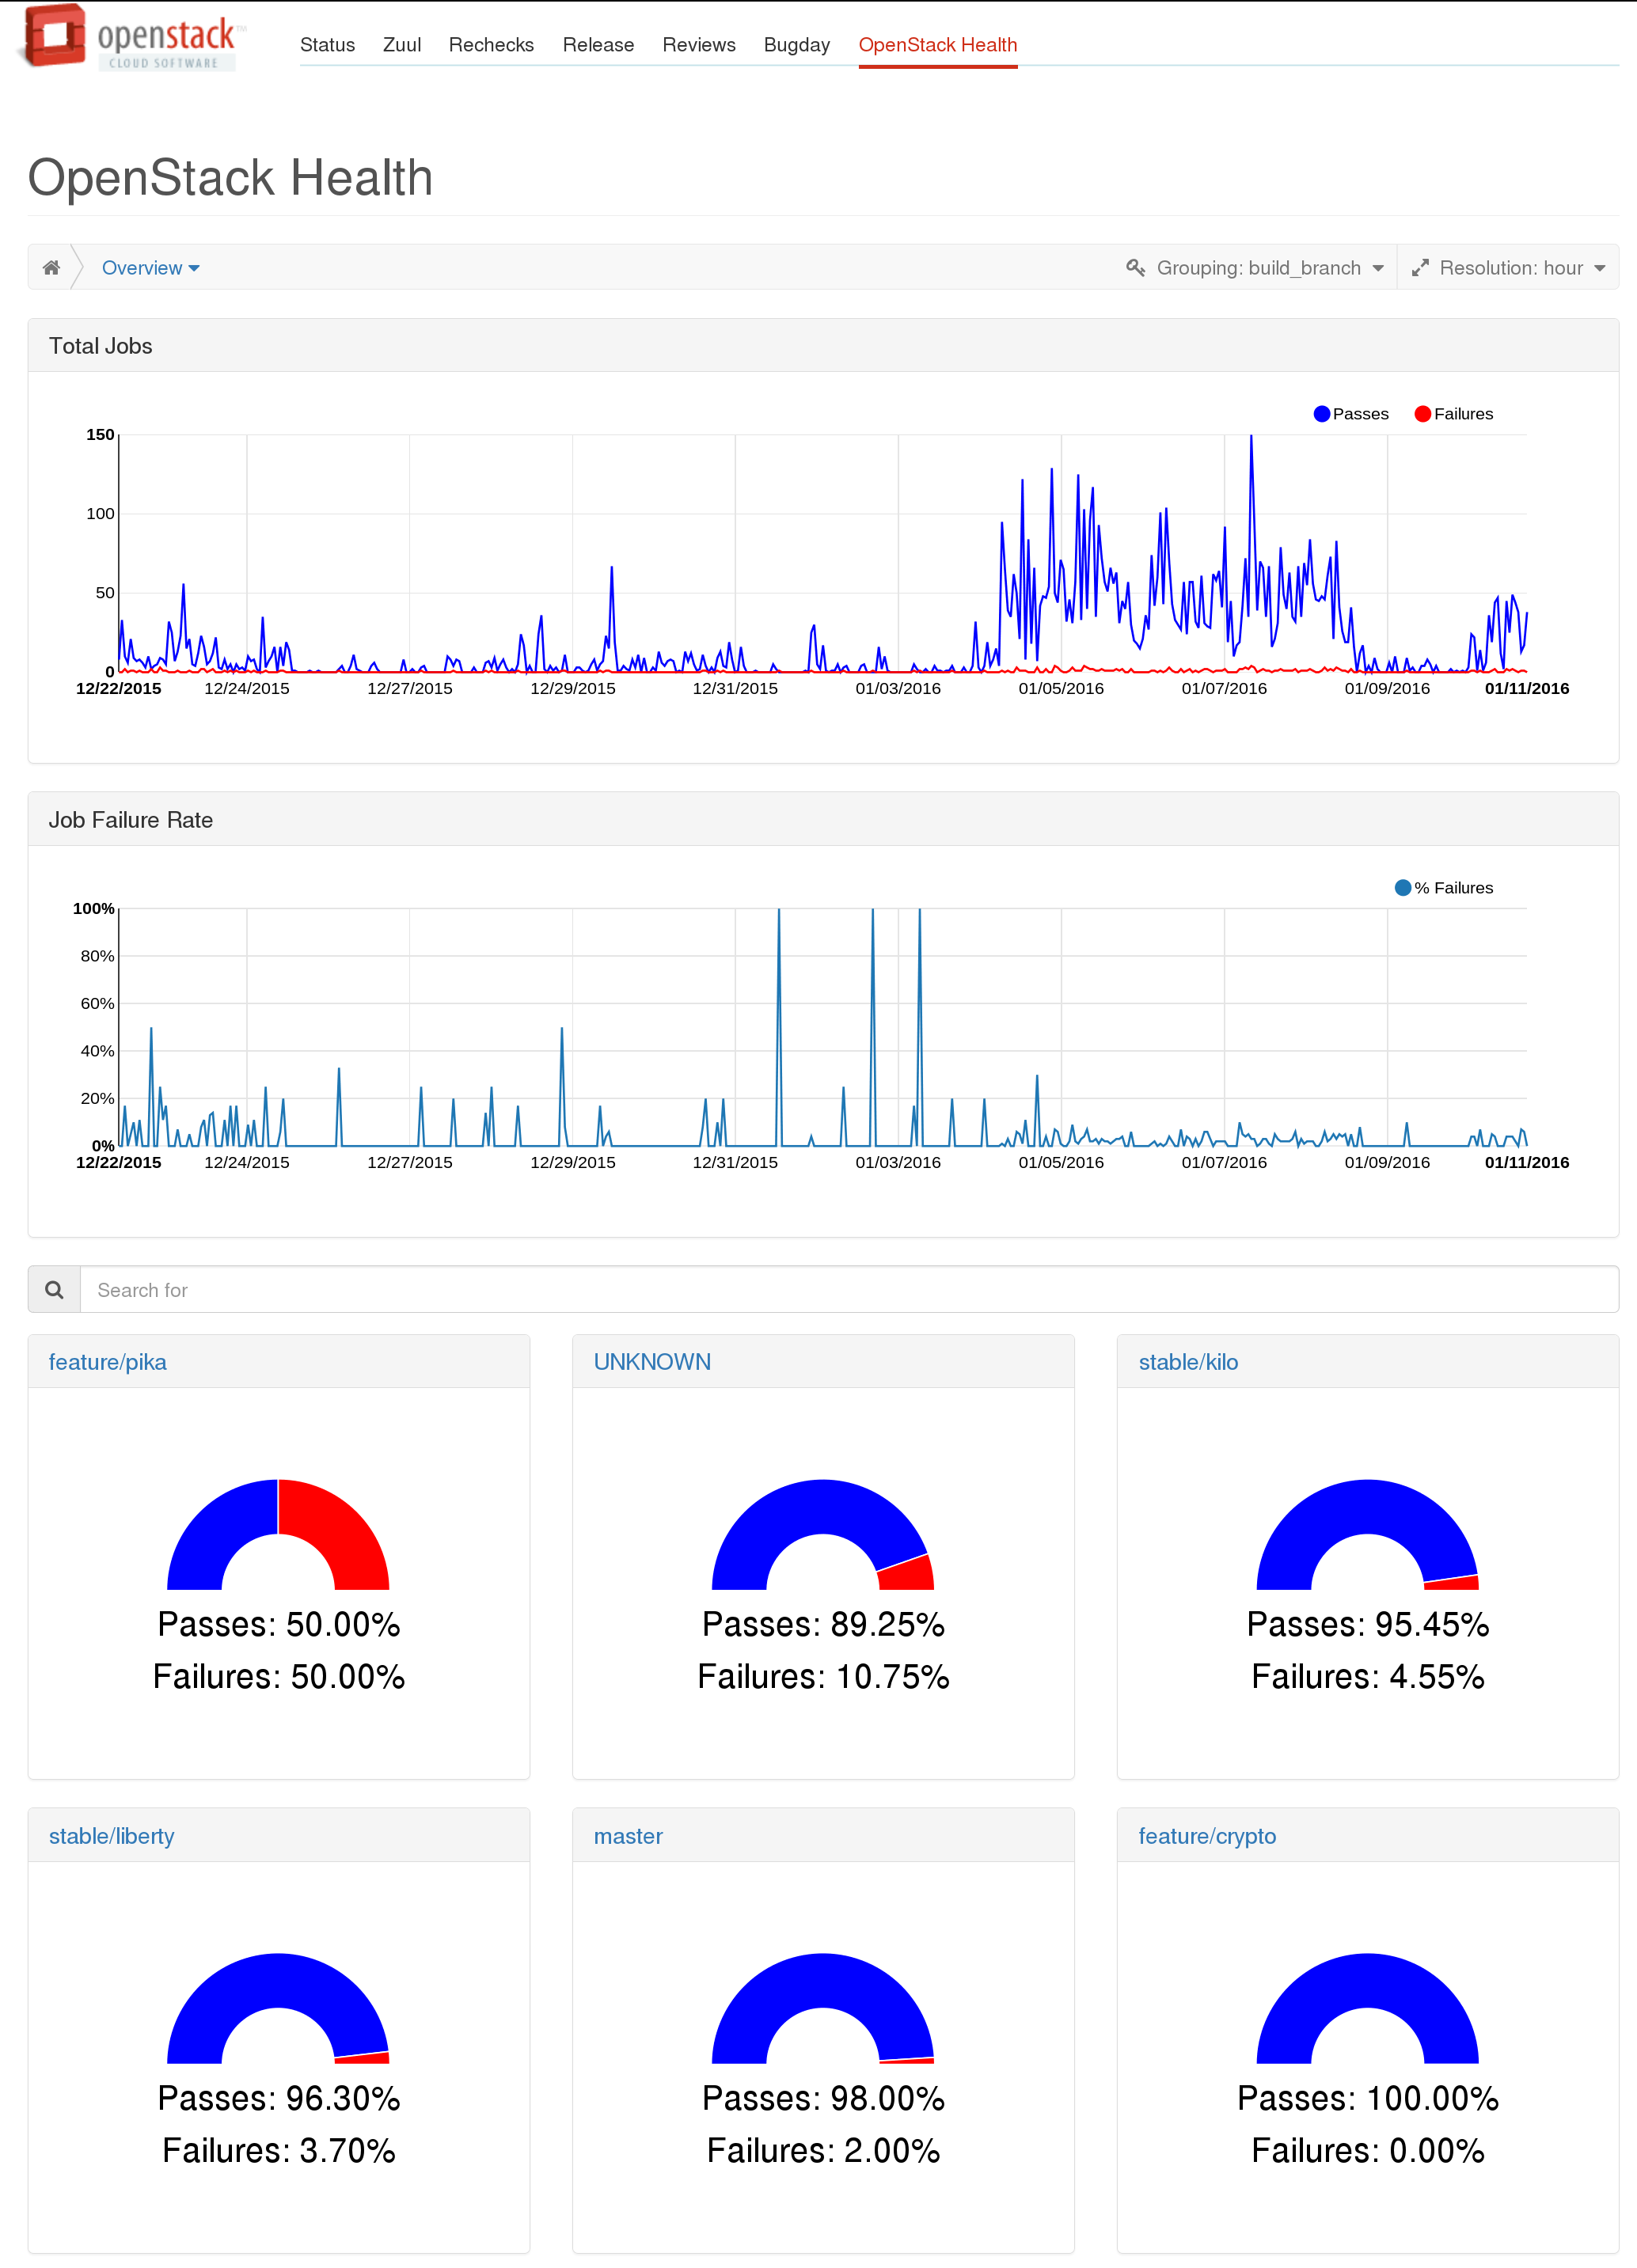
The grouped gauges will let you dive down into a top level view of runs for the selected group, which also shows high level per job statistics:
http://status.openstack.org/openstack-health/#/g/build_branch/stable%252Fkilo
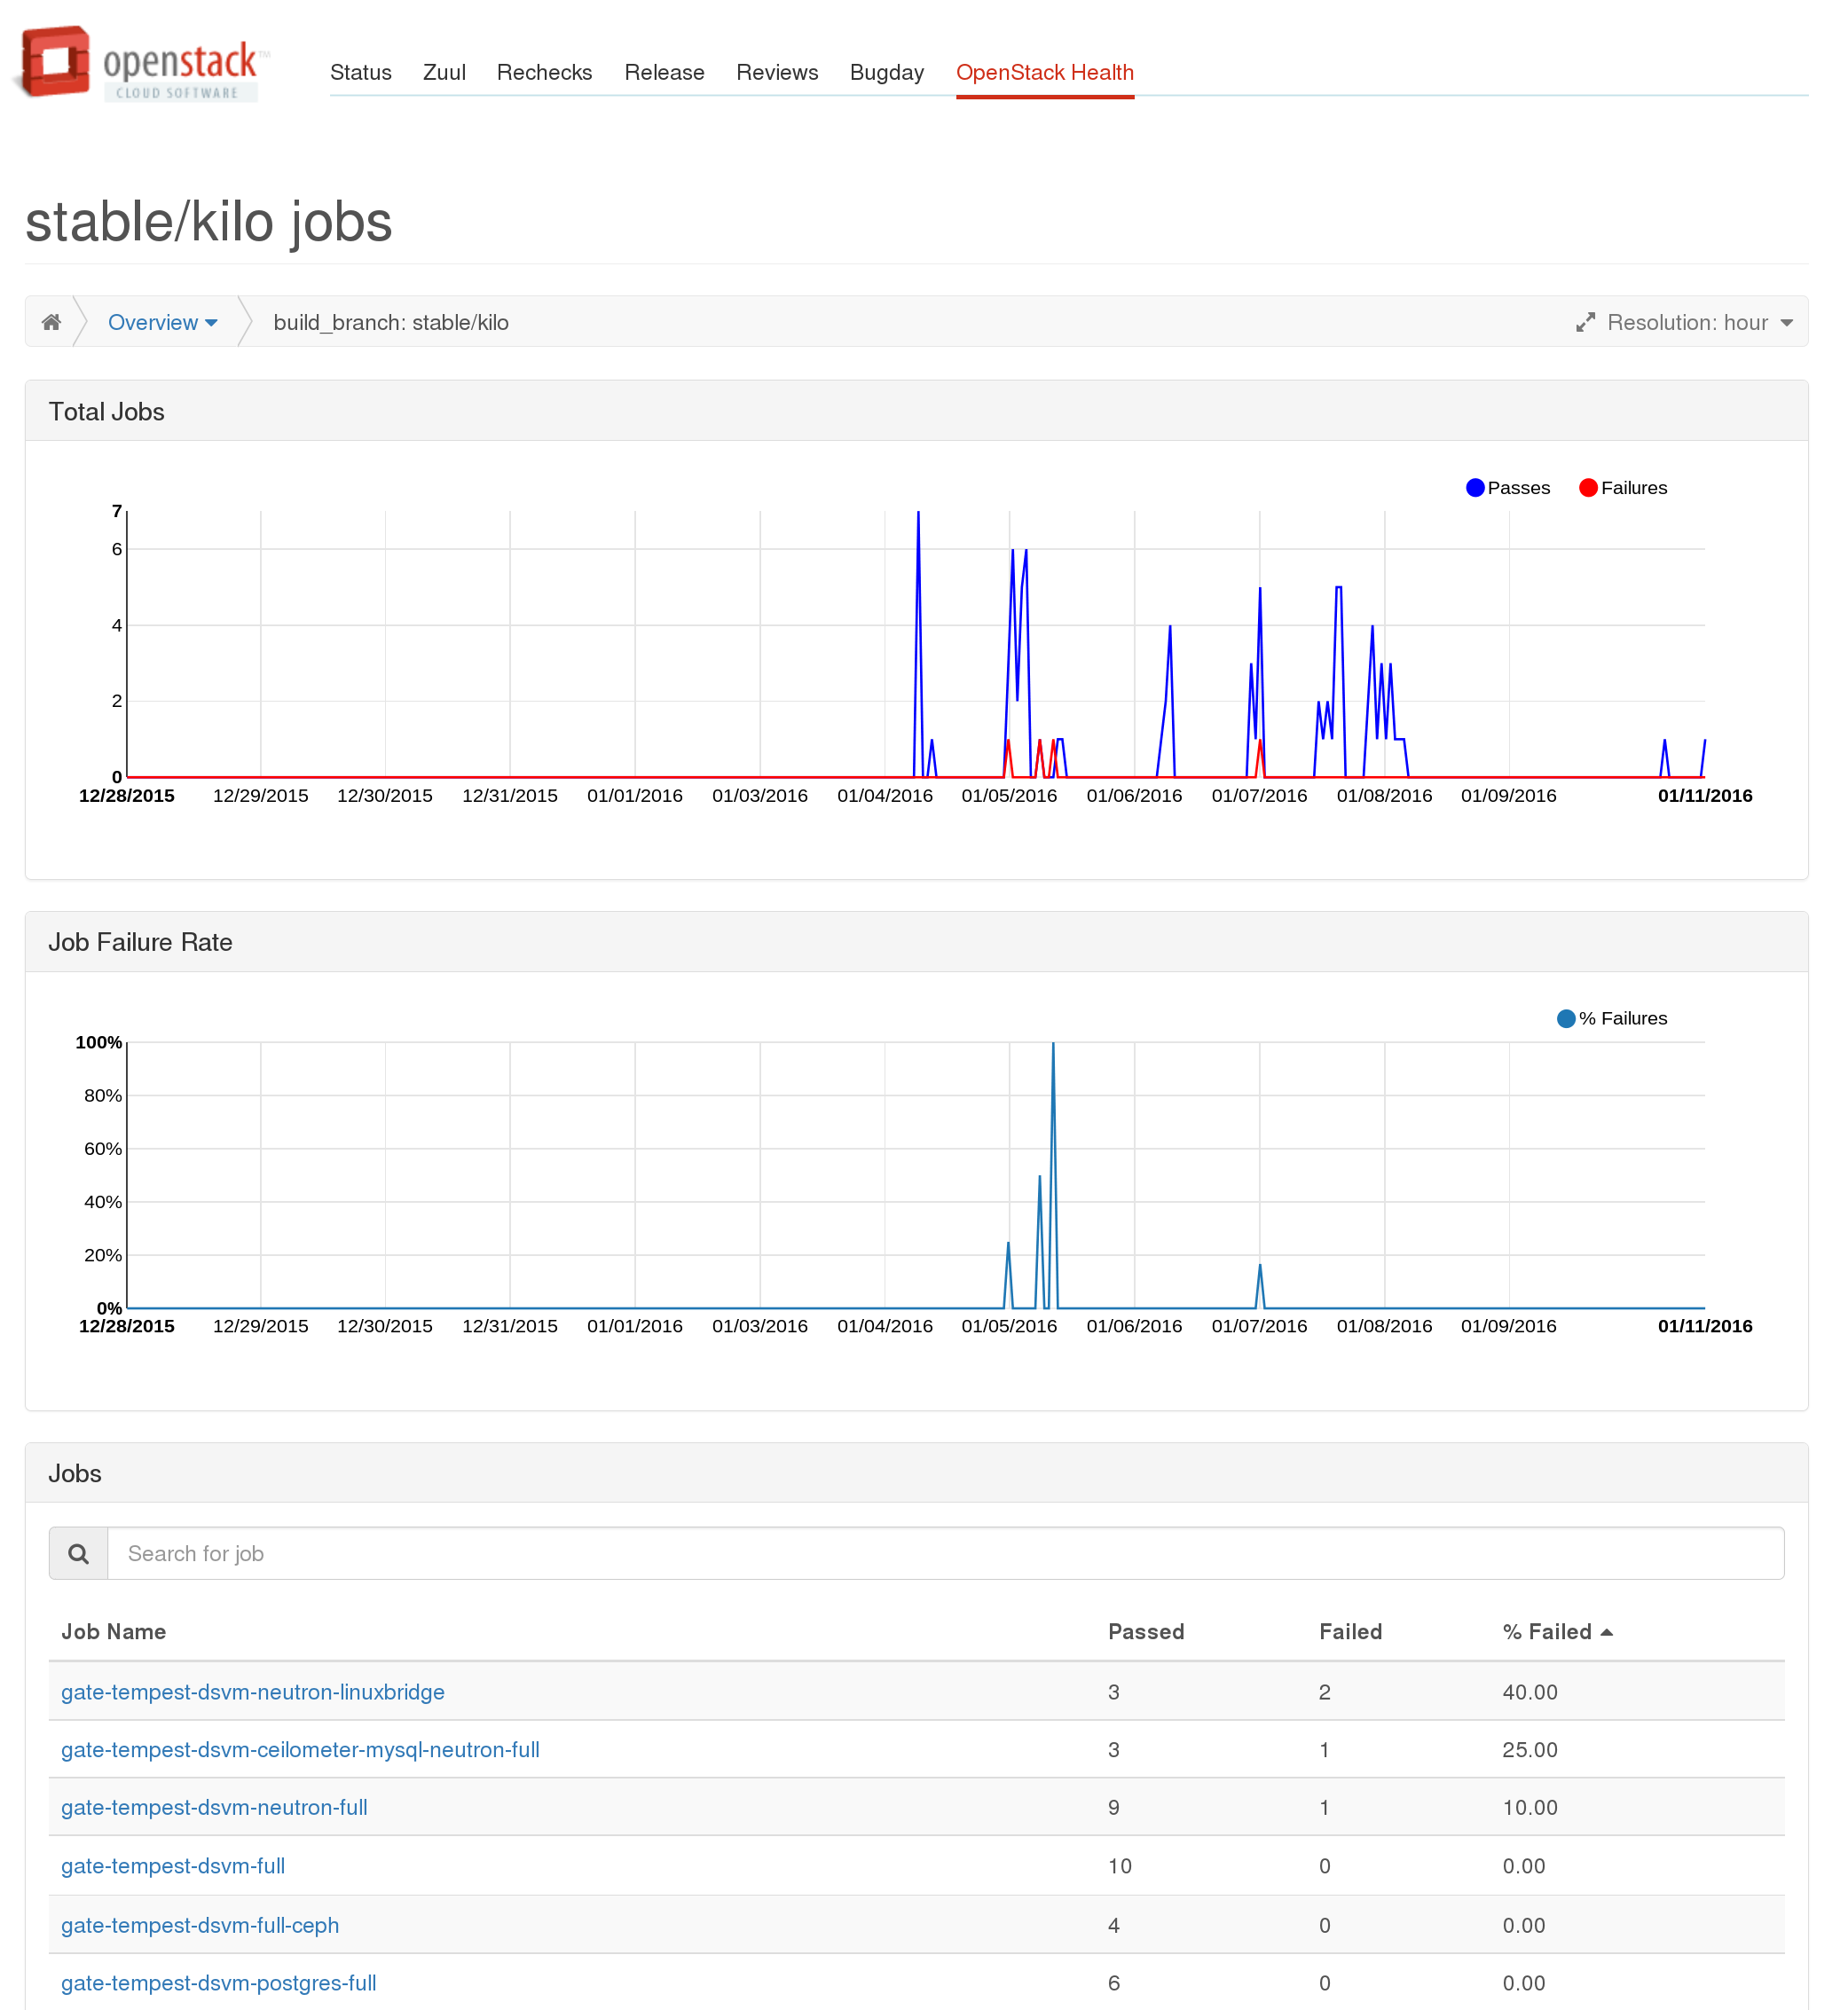
From the table you can go to a per job view, showing more detailed information about an individual job which will also show the aggregate information about all the tests which were run as part of that particular job. Note this view is not filtered by the group you came to it from. For example if you navigate to a job’s page via the stable/kilo page the results will be for all runs of that job, not just those on stable/kilo.
http://status.openstack.org/openstack-health/#/job/gate-tempest-dsvm-neutron-full
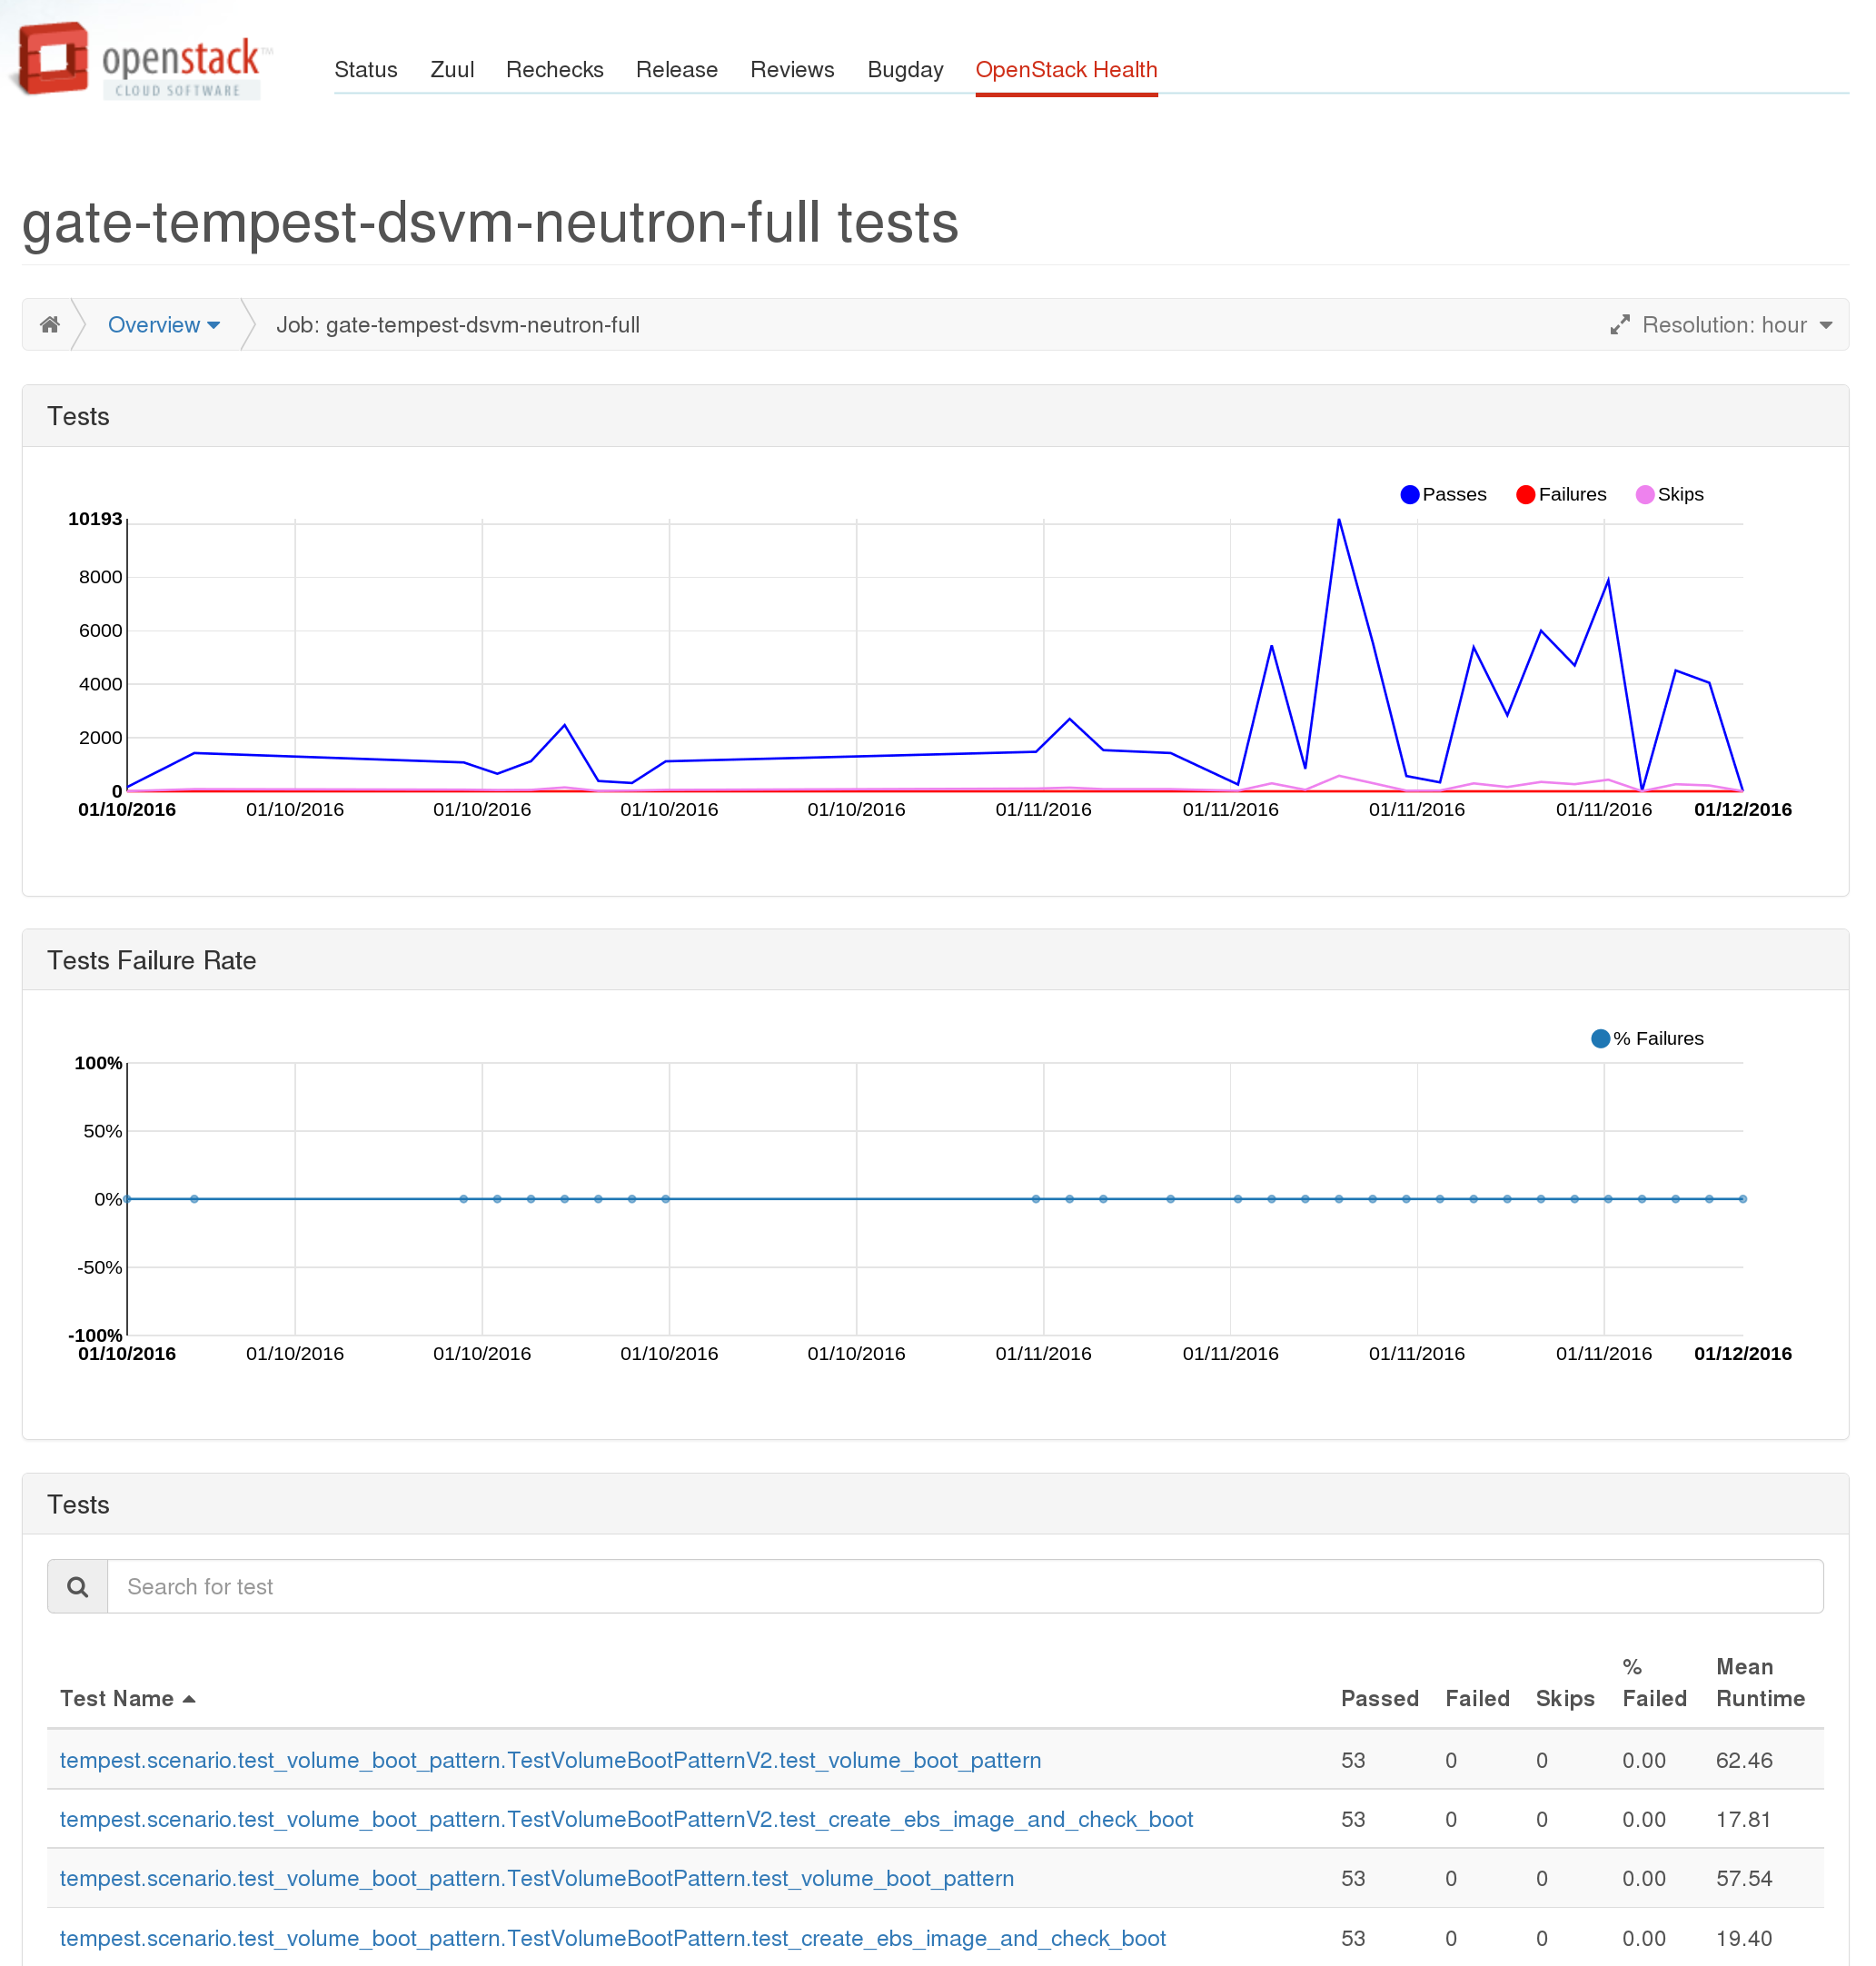
From here you can look at the run time and failure information about an individual test across all runs by selecting it from the table:
http://status.openstack.org/openstack-health/#/test/tempest.scenario.test_server_advanced_ops.TestServerAdvancedOps.test_resize_server_confirm
 You can also look at all the tests run as part of all jobs (grouped by package) showing a sortable and filterable table of high level stats for each test: http://status.openstack.org/openstack-health/#/tests This also provides an alternate path to get to the per test pages by selecting a test from these tables.

Current Limitations
Only gate and tempest runs
Right now we’re only collecting results for tempest and grenade jobs in the gate and periodic pipelines in the subunit2sql DB. This means that the results on the dashboard do not including anything from the check or experimental queues and any jobs that don’t run tempest are also missing. However, this is fully configurable and is just the current state of what we’re collecting. There are 2 primary reasons for this. First we’re leaving it as gate/periodic for data “purity”. The jobs running in these queues are coming from a known good state and are expected to pass. In the gate case the tests have already passed the check queue jobs once and have been approved by 2 core reviewers. In the case of periodic jobs it is being run with the current state of the repo which is assumed good because all changes had to pass tests to merge.
The second aspect is mostly just a historical artifact of how we originally setup the subunit2sql data collection. I originally setup the subunit2sql data collection to only collect tempest runs because that’s all I was interested in collecting when I first started the project. It also was the obvious choice since tempest dsvm jobs give us insight into how OpenStack works in practice since it fully deploys a cloud and does real work. Now that we have the openstack-health dashboard it makes sense to expand this to all test jobs. The only blocker for doing this right now is the DB size. Before we can start adding a lot more data to the DB we need to setup a pruning mechanism so we remove old data from the DB. Right now we have data for every gating tempest and grenade run since the system was first turned on in Nov. of 2014. The plan is to keep a full development cycle (which is basically 6 months) worth of data in the DB and drop the rest. The patch adding this is in progress: https://review.openstack.org/176564
I expect we’ll expand the database to results for all periodic and gate jobs in the near future. But, as for expanding it beyond gate that’s a not as clear cut. It makes tracking things like non-voting jobs much easier, but at the same time it will pollutes the data set used for anything operating at the per test level, or when looking across all runs. I think before we can start to look at expanding it to include the check queue, we’ll need to improve the DB filtering we’re using to ensure we don’t pollute the data by doing this. (an alternative I’ve had in the back of my head is to set up a second database for “dirty” results)
Failures Before Test Runs aren’t counted
If you look at the results in the subunit2sql DB they only include test runs that actually started tempest. This makes perfect sense if you look at test results get populated in the subunit2sql DB. They depend on a subunit stream being in the collected artifacts on the log server for a job. If the tests never run, like in the case that devstack or devstack-gate fails setting things up, a subunit stream isn’t generated.
We’re looking at 2 different approaches to address this issue. The first is simply to generate subunit results for non-test run phases of the job. For example, a devstack result stream which will say whether devstack (or phases of devstack) were successful or not. You can see the patches in progress for doing this here: https://review.openstack.org/#/q/topic:devstack-subunit
The second approach is to add a mysql reporter to zuul. This will store the results and execution time from from zuul in another database where we can query that instead of subunit2sql. This will require modifying the REST API to use the new database where it makes sense. You can see the patch in progress for adding the new reporter here:
https://review.openstack.org/#/c/223333/
Future Direction
Where I’d like to see the dashboard move is to be the first place everyone goes to for finding any information about gate results. I think we’ve built a good starting point and framework for eventually getting there. But there’s still a lot of work to do here. Some of the things I’d like to eventually see is to have the dashboard integrated with things like elastic-recheck and stackviz. So we can see known bugs causing failures when we’re looking at recent runs. Or have a stackviz view of an individual run dynamically generated from the dashboard.
One short term goal for me with the project is to replace the periodic job result emails that are sent to the openstack-qa ML (which is dead but hasn’t been removed so we have a place for emails) and the openstack-stable ML with the dashboard. We’re almost at the point where I feel we can do that.
For those interested in the contributing to this effort. Some helpful links are the bug tracker: https://bugs.launchpad.net/openstack-health and we also have an etherpad to track ongoing work items or features here: https://etherpad.openstack.org/p/openstack-health-tracking (although it is often stale and needs to be updated and/or pruned)
Update 02-18-2016:
The limitations I previously outlined in the post have been partially addressed and aren’t completely accurate anymore. First with: https://review.openstack.org/#/c/279299/ we’ve expanded the scope of the subunit stream collection into the subunit2sql DB to collect for all jobs in the gate or periodic pipelines. This means that openstack-health should contain information for all jobs that run in the gate as long as they export a subunit stream for the run in the proper location. However, we have yet to expand the collection to any jobs outside of gate or periodic, for the “data purity” concerns that I mentioned originally.
The other limitation of not knowing about all failures has been addressed partially by adding subunit output to devstack with: https://review.openstack.org/#/c/273096/ This means any failures that occur in devstack will be properly counted on openstack-health. Failures that occur before devstack (or any subunit output is generated in non-dsvm jobs) will still not be known because there isn’t any artifact available to populate the subunit2sql db with. The zuul mysql reporter is likely the only way to completely cover this gap, because adding subunit output for devstack-gate (or the jenkins slave scripts to run other tests) is a bit trickier to avoid duplicating result or timing data and likely not worth the effort to implement. It also likely won’t be a complete solution either
One thought on “Exploring the OpenStack-Health dashboard”