Recently I was helping someone debug a gate failure they had hit on one of their patches. After going through the logs with them and finding the cause of the failures, I was asked to go through how I debug gate failures. To help people understand how to get from a failure to a fix.
I figured I would go through what I did and why on that particular failure and use it as an example to explain my initial debug process. I do want to preface this by saying that I wasted a great deal of time debugging this failure, because I missed certain details at first, but I’m leaving all of those steps in here on purpose.
The log url for this failure is:
http://logs.openstack.org/75/116775/2/check/check-tempest-dsvm-neutron-full/ab17a70/
To start I normally look at the console file and scroll to the bottom and work my way up the file until I see the first failure traceback. (or just do a search for “output below”) The failure output from tempest (generated by subunit-trace.py) will print all the stack traces in FIFO order after the run is finished. Doing that here yielded the following:
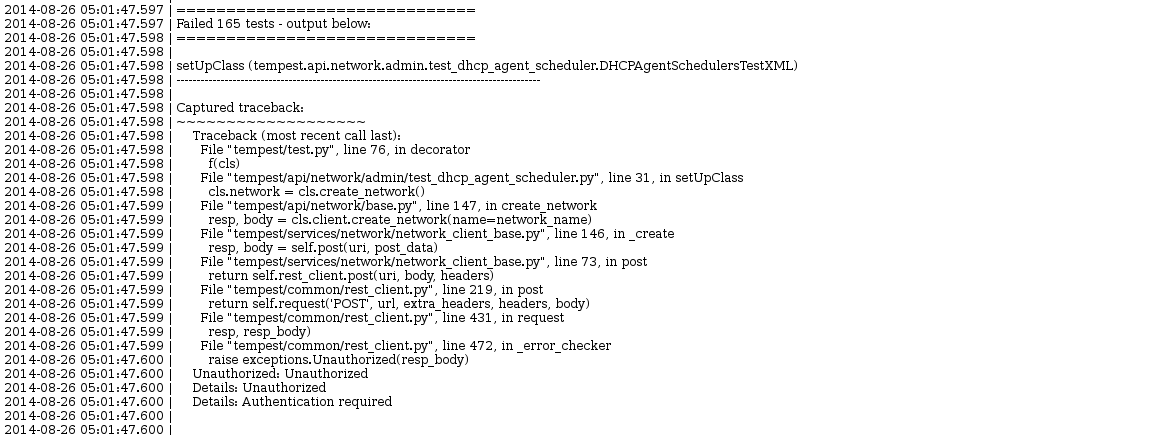
Looking at this traceback it looks like during the setUpClass stage of the test class:
tempest.api.network.admin.dhcp_agent_schedule.DHCPAgentSchedulersTestXML
normally I would start by looking at the service logs related to that failing api call. I often need to pull up the tempest code to get context on what the API call is attempting to do when it failed. In this case the code for the setUpClass is here.
However, in this particular case I was pointed specifically to a different failure slightly further down in the file:
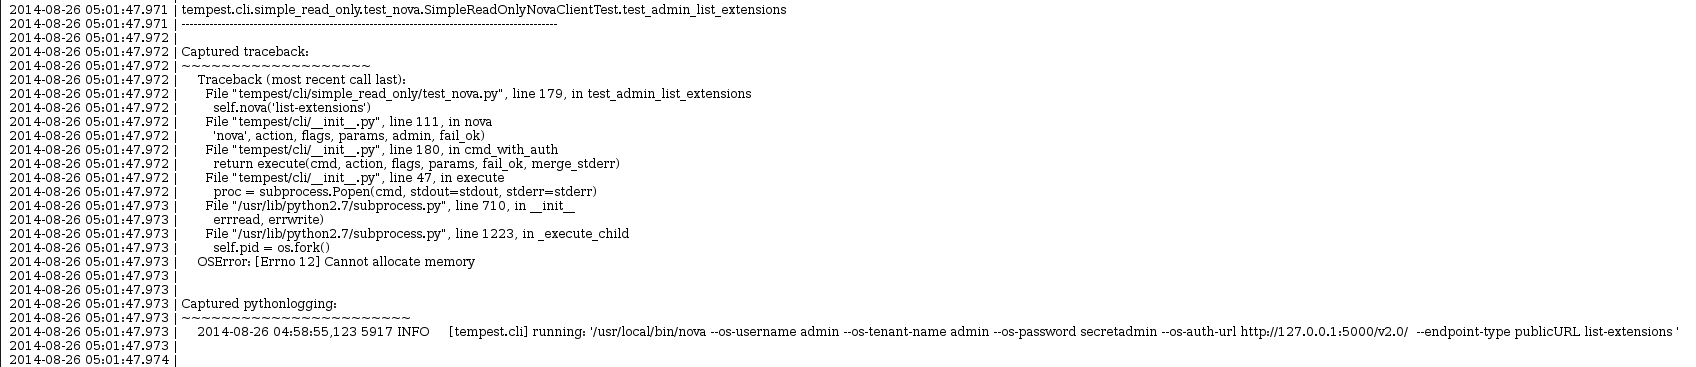
So I began by debugging from there first. When I saw an out of memory error, my first thought was that the kernel will log that, so I looked at the syslog for the run. Looking at the syslog file I searched for “out of memory” (because I forgot that oom-killer is the name of what kills things) around the time that job failed Doing this search yielded:
Looking at this was not helpful. The process killed here was named python and didn’t contain what was actually being run. (in retrospect I suspect it was actually the client process being started by subprocess for the cli test) So while I confirmed that a lack of memory was an issue during the run, I was no closer to identifying why we ran out of memory. The gate slaves should have plenty of ram at 8GB and if we were really pushing the limits of that we’d be seeing far more failures. So my next thought was that it could have just been a cascading issue caused by earlier failures in the run.
I also took a look at the dstat log for around that time to try and see if I could identify a process that was eating all the memory. But, nothing stood out, besides that memory usage was above 7GB for a good part of the run. Also, since the dstat log only displays the most expensive process by cpu utilization it didn’t really help with identifying what was eating all the memory.
So at this point I decided to go back to my normal process and look at the service logs for the first failure. To make it easier to parse the service logs I first collected some information from the tempest logs: the req-id for the failed request, and the approximate timestamp that the request failed. Having the timestamp is more of a backup, just in case we can’t use or find the request id then we know when in the logs to look for an issue.
Since the console output prints the traceback we know what to search for in the tempest log, since tracebacks will also be logged. Finding the traceback in the logs yielded:
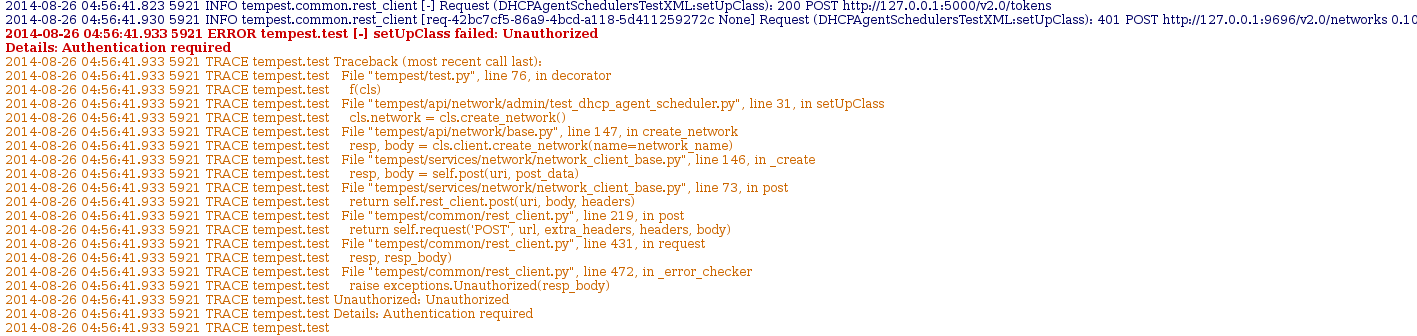
This snippet shows the tempest api call, which is going to neutron (this can be determine either through the test code or the url the request is being sent to) and provides both pieces of information. The req-id: req-42bc7cf5-86a9-4bcd-a118-5d411259272c and the approximate time the request finished: 2014-08-26 04:56:41.930. The one thing to look out for when manually looking through logs is that in a gate run tempest is running in at least 4 processes at once, so the logs will be interleaved by api calls happening at the same time. This is true in all of the services logs too.
At this point for a first pass I would normally open up the neutron service log with just tracebacks being shown to see if anything stood out. To do this I would leverage one of the niceties from os-loganalyze which is filtering by log level. By appending: “?level=TRACE” to the log file url it will only display tracebacks, warnings, and errors in the logs. However, I did not do this because from experience I know that there are too many tracebacks in the neutron logs which are part of a successful run to make that worthwhile. (which is it’s own problem, and not unique to neutron)
Instead I just opened up the entire log and searched for the request-id we found from the tempest logs. There were no hits, this is because neutron doesn’t log the request ids for each api call’s request and response. It only uses them for logging context on internal operations. This is actually a large issue with openstack, the logging consistency and standards need to be improved in order to debug failures like this. So instead, using the timestamp we also pulled from the tempest log, I manually looked in the logs around the timestamp to find the 401 response being sent from neutron. (the timestamps rarely line up exactly because of the time it takes to send and receive the http traffic)
Finding this in the logs yielded an interesting result:
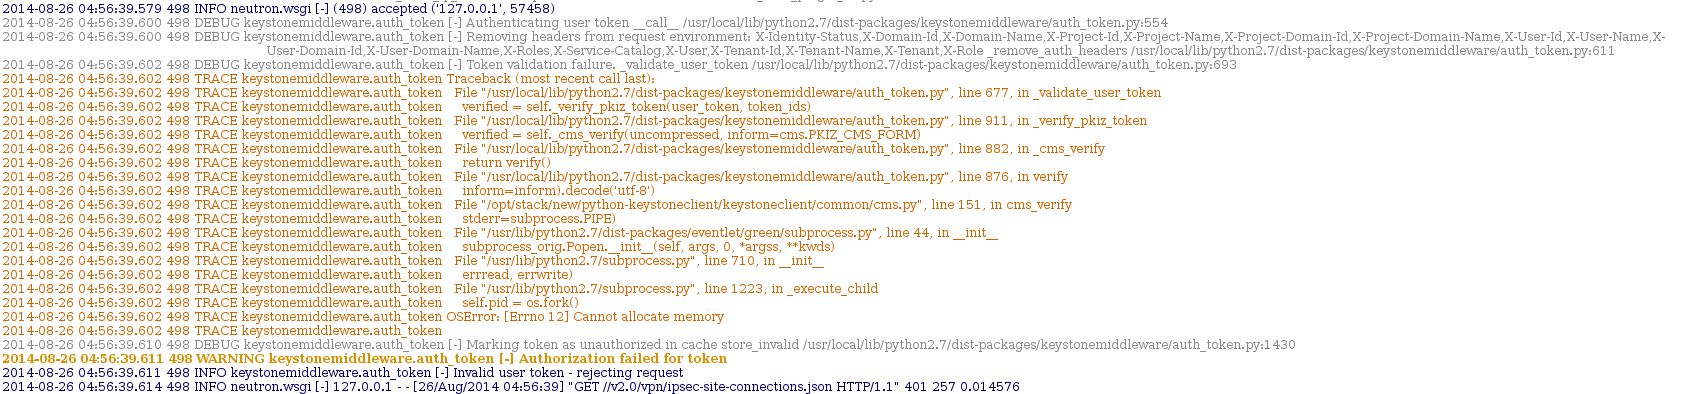
This snippet from the logs shows the incoming request from tempest then neutron attempting to use keystone middleware to authenticate the token that was used for the request, when subprocess returned an out of memory error. This means that the first test failure from the test run was also caused by running out of memory.
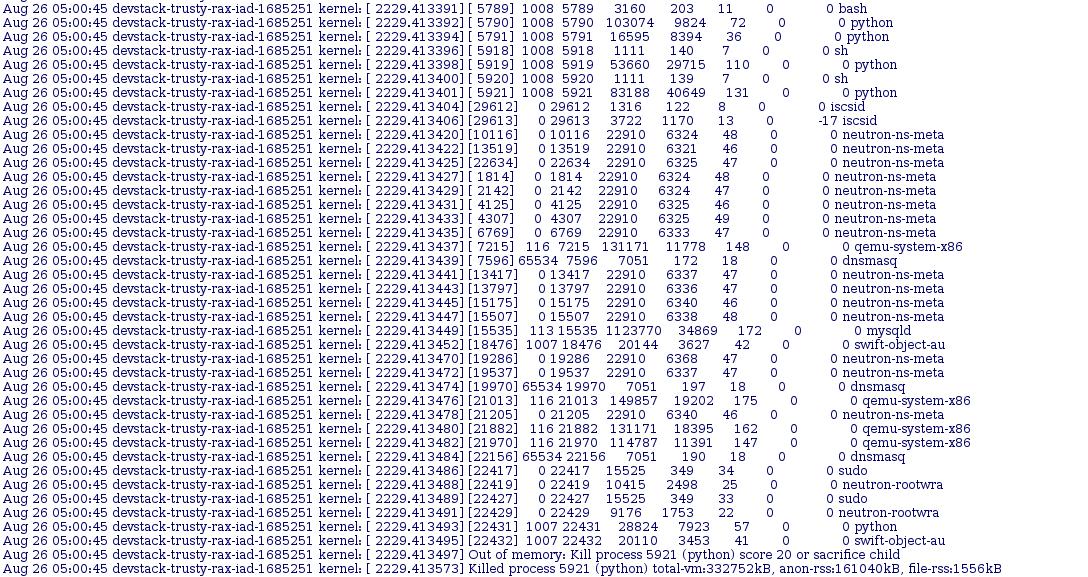
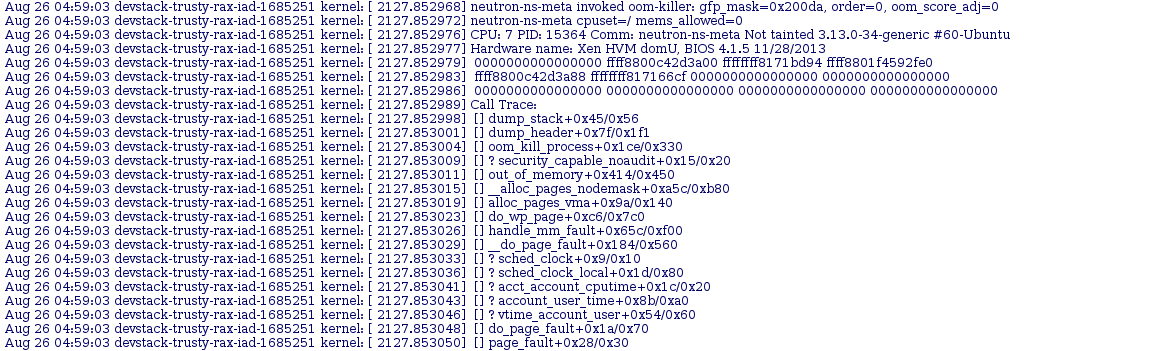
So because the first failure was also memory related I decided to go back to the syslog and look from the top instead of targeting my search around the timestamp of the other failure. Doing this was a bit more fruitful than the first time. Mostly because doing a search for oom-killer (which I was reminded of by clarkb on irc) instead of “out of memory” returned the top of the kernel dump:
 and at the bottom:
![]()
This shows that neutron-ns-meta was causing a mysqld process to be killed which explains the first failures and a lot of the other strange behavior that was going on during the run. Using this I went to logstash to see how often things were failing like this and when it was happening. I started with a simple query: tags:syslog AND message:”oom-killer” which showed this was occurring only on neutron jobs that failed. Although not very frequently, only 14 hits in the past 10 days.
At this point, I felt like there was enough to open a bug against neutron. Since further debug into the underlying cause of the memory leak would require more time than I had. The underlying failure may be in neutron, or it could be caused by something else and running with neutron is just causing it to be hit. But, the information found from the logs with the links is enough to report the issue as a bug against neutron, and we can continue the debug and investigation in the launchpad bug. Also, using the logstash query above is enough to create an elastic-recheck fingerprint to track the failure moving forward. It might turn out that the memory leak is just a symptom of a larger issue and the elastic recheck query is only capturing a piece of the issue.
Working through failures like this is a continuous and ever changing process, and the steps I outlined here probably won’t be completely valid in a couple of weeks. Additionally, everyone tackles this process in a different manner, it’s really shaped by personal experience working on OpenStack code, dealing with a running OpenStack, and debugging failures. So how I went about debugging this specific failure is probably different from anyone else, and I may have even come up with the wrong conclusion. (which would really suck after writing all of this) But, that is just part of the process, and taking the feedback from that will just make my next triage adventure more successful.
Since getting an elastic recheck query is just the first step in fixing a gate failure, I’ll probably periodically make follow on posts here with updates from working on that bug just to keep track of it’s status moving forward.
One thought on “Triaging and classifying a gate failure”